Count the workers and Mayfair's crime rate falls by 87%
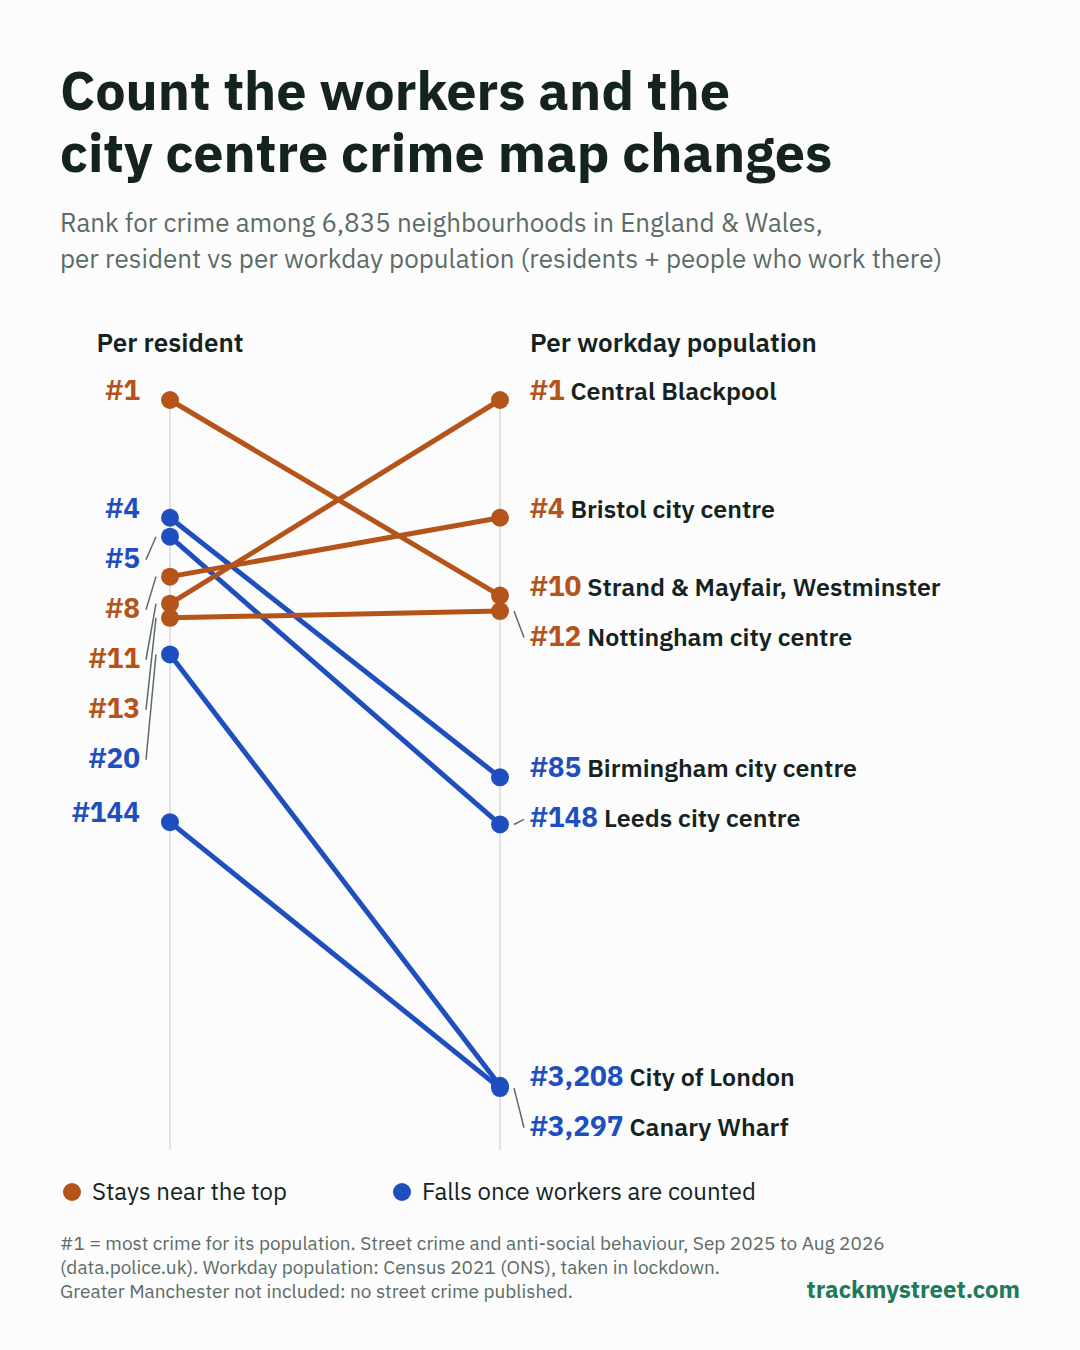
Crime rates are usually worked out per resident, which makes busy city centres look far worse than they are for the people who live there. Count the people who work there as well, and the City of London drops from 20th of 6,835 neighbourhoods to 3,208th.
Published
Strand, St James & Mayfair: still busy, but not first
This corner of Westminster recorded 17,156 crimes in the year to August 2026, for just 7,027 residents. That is 2,441 per 1,000 residents, the highest in England & Wales. But about 53,000 people are there on a working day. Per workday population the rate is 323 per 1,000, and the area ranks 10th.
Half of its crime is theft (27% theft from the person, 24% other theft), much of it from visitors. The Met says street theft of phones in London fell 21% in the year to August 2026, and that phone theft and robbery in Westminster has fallen by almost half (Met Police, 8 October 2026).
City of London and Canary Wharf: offices, not hotspots
The City has 15,111 residents and nearly 99,000 people on a working day. Per resident it has 496 crimes per 1,000. Per workday population that falls to 76, below the England & Wales average of 85. Canary Wharf falls from 144th to 3,297th, with 75 crimes per 1,000 workday population.
Blackpool seafront: top of the workday list
Seaside centres have few commuters, so counting workers changes little. Central Blackpool rises from 11th to 1st (410 per 1,000 workday population), and North Shore and South Promenade & Seasiders Way take 2nd and 3rd. Violence and sexual offences are 41% to 49% of their crime. Their crowds are visitors, whom neither measure counts.
Nottingham and Bristol: high on both
Some centres stay near the top either way. Nottingham's City Centre & Trent Bridge ranks 13th per resident and 12th per workday population. Bristol's City Centre & Harbourside ranks 8th and 4th. Citywide, Nottingham (133 crimes per 1,000 residents) and Bristol (130) have the highest rates of the large cities we looked at. By contrast, Leeds city centre falls from 5th to 148th and Birmingham's from 4th to 85th.
What this means for you
- Renting near work in a city centre? A per-resident rate exaggerates the risk where offices dominate. Look at the workday figure and at the kinds of crime too. Theft and night-time violence cluster on a few streets.
- Moving within a city? Compare neighbourhoods on the same measure. A centre and a suburb can swap places depending on which one you use.
- Visitors count too. Neither measure includes shoppers, tourists or night-time crowds. That is why the West End and Blackpool stay high.
How we did this
We counted street crime and anti-social behaviour reported to data.police.uk from September 2025 to August 2026, by neighbourhood (2021 middle layer super output areas). We divided by residents (ONS's latest small area estimates) and by workday population. That is the residents plus the area's net inflow of workers in Census 2021, which ONS defines as people in work counted where they work and everyone else counted at home (Nomis).
Census Day, 21 March 2021, fell during a national lockdown, when people were told to work from home where possible. City centre workday populations are therefore lower than on a normal working day, so their true workday rates are likely lower still.
Greater Manchester is left out. Greater Manchester Police currently supply no crime data to data.police.uk (police.uk changelog). Gloucestershire published nothing after January 2026, so its figures are too low. Crimes are mapped to approximate points, so a few near a boundary may be counted in the next area.
Check your area
See the crime figures for your own street, adjusted for the people who work there, on the map at trackmystreet.com/uk.
Data
- Street crime and anti-social behaviour, Sep 2025 to Aug 2026: data.police.uk (Open Government Licence v3.0)
- Census 2021 workday population (WD002): Office for National Statistics, via Nomis (Open Government Licence v3.0)
- Small area population estimates: Office for National Statistics (Open Government Licence v3.0)
- Neighbourhood (MSOA) names: House of Commons Library (Open Parliament Licence)
Changes to this article
- 2026-11: first published.