Insights
What the data says about where to live
Articles built from the open data behind our map: house prices, rents, crime, energy ratings and more, for England and Wales.
-
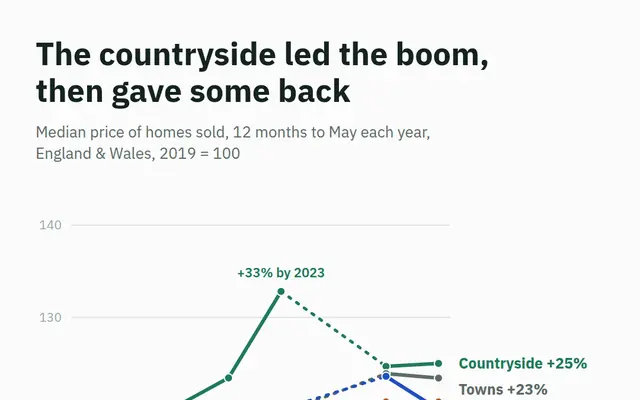 Countryside home prices rose 33% to 2023, then slipped 6%
Homes outside any town or village led the pandemic boom in England & Wales. Since 2023 their prices have fallen back, while towns, cities and villages held level.
November 2026
-
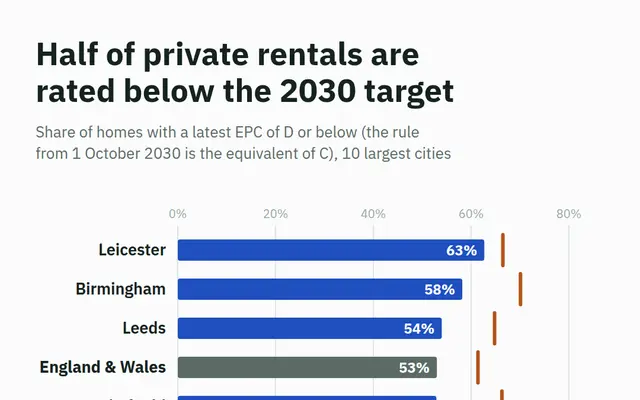 53% of private rentals are rated below the 2030 EPC target
About 1.76 million privately rented homes in England & Wales have a latest EPC of D or below. Leicester's share is highest of the big cities, Tower Hamlets' lowest.
November 2026
-
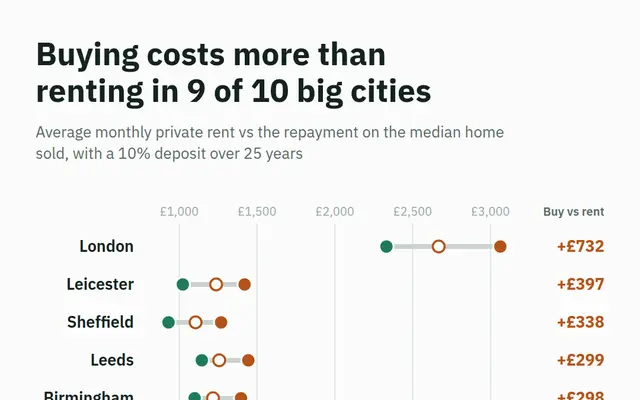 At today's rates, buying beats renting in just 1 of 10 big cities
With a 10% deposit at 6.04%, the repayment on a typical home is below the average rent only in Newcastle. On flats, five cities come out cheaper to buy.
November 2026
-
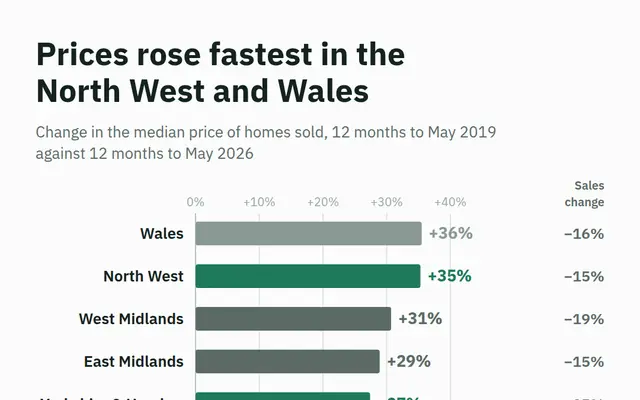 Home prices in the North rose 30% since 2019, the South 19%
Northern prices grew faster than southern ones since before the pandemic, yet the pound gap still widened, to £142,000. Sales fell by similar amounts in most regions.
November 2026
-
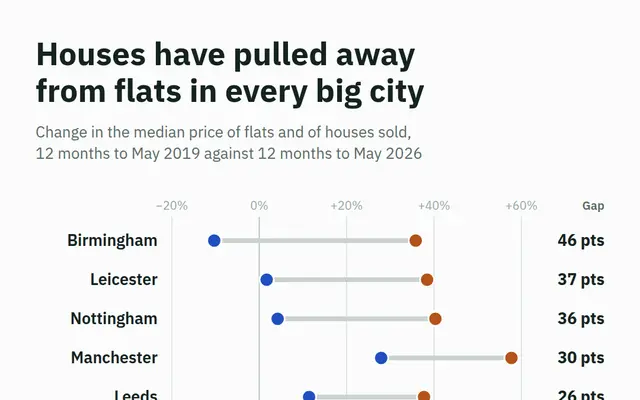 Birmingham flats sell for 10% less than in 2019, houses 36% more
Since 2019 house prices have pulled away from flat prices in all 10 of England's largest cities. In Birmingham the step from a flat to a house grew from £15,000 to £97,000.
November 2026
-
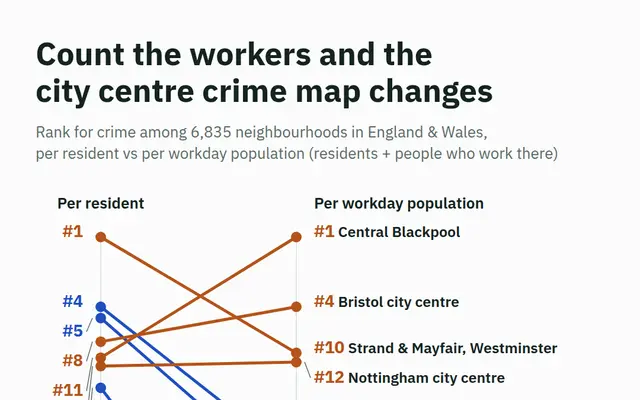 Count the workers and Mayfair's crime rate falls by 87%
City centre crime rates look very different once the people who work there are counted. We ranked 6,835 neighbourhoods in England & Wales both ways.
November 2026