Birmingham flats sell for 10% less than in 2019, houses 36% more
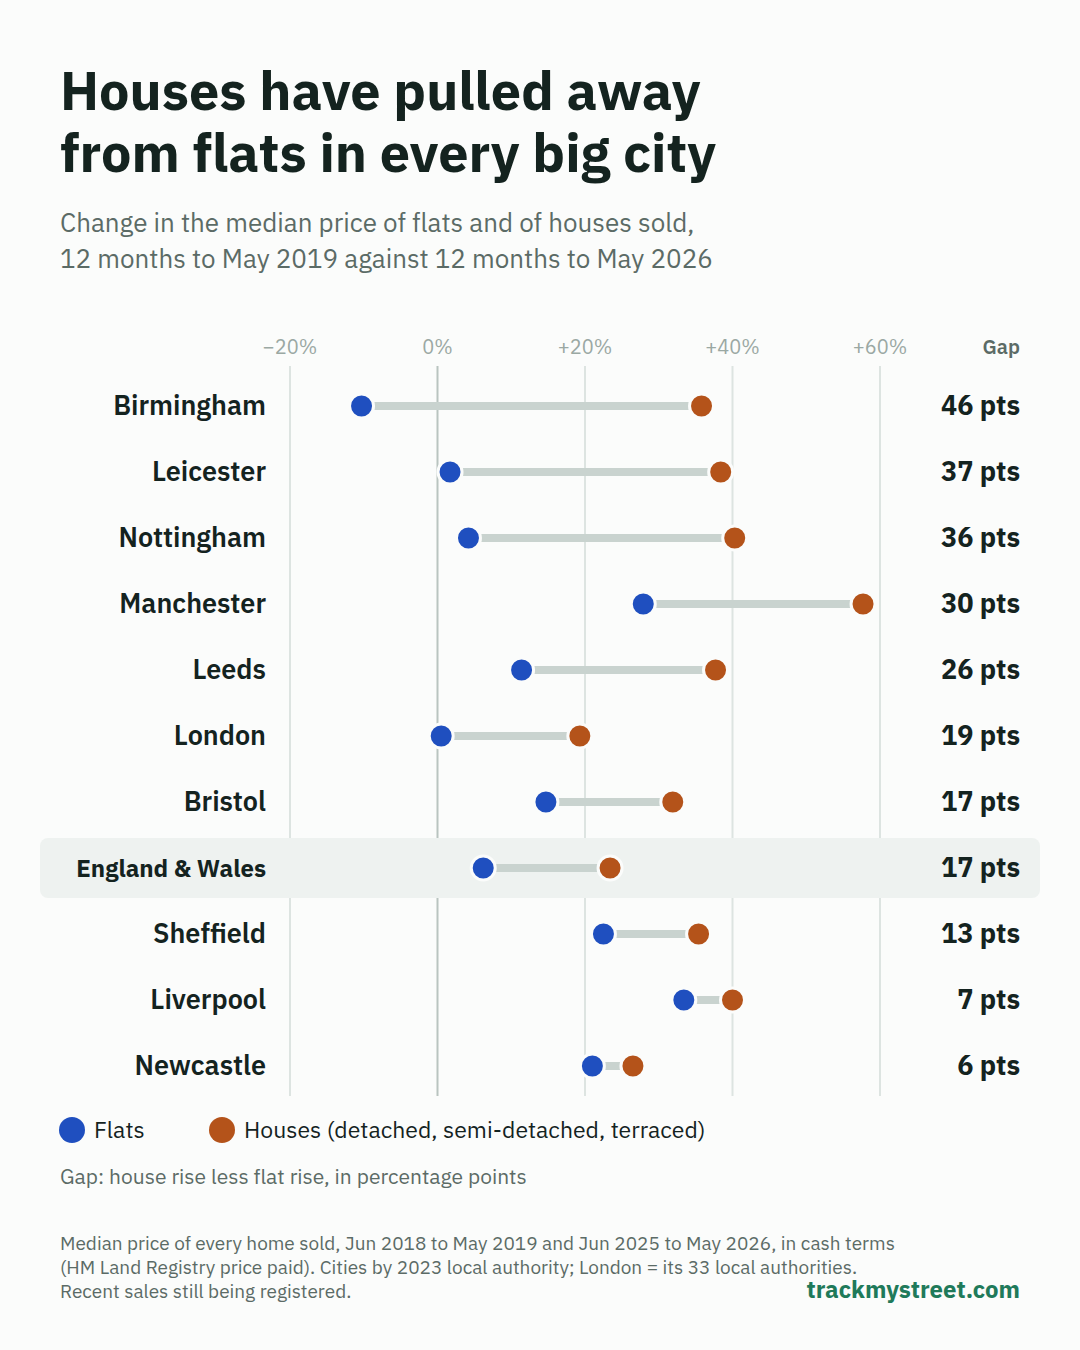
In all 10 of England's largest cities, house prices have risen faster than flat prices since before the pandemic, and flat sales have fallen further. For a flat owner hoping to move up to a house, the step is far bigger than it was in 2019.
Published
Birmingham: from almost level to £97,000 apart
In the 12 months to May 2019 the median flat sold in Birmingham cost £165,000 and the median house £180,000, only £15,000 more. In the 12 months to May 2026 the flat cost £148,000, down 10%, and the house £245,000, up 36%. The gap is now £97,000. Measured per square metre, which allows for the size of homes sold, Birmingham's flats fell 15% and its houses rose 31%.
Flat sales halved, from 4,086 to 2,095, while house sales fell 19%.
London: flats flat, houses up a fifth
London's median flat price barely moved, from £410,000 to £412,000, while the median house rose 19% to £611,000. The median flat price fell in cash terms in 19 of the 33 boroughs, most in the City of London (20%), Westminster (16%) and Greenwich (15%). ONS's latest figures show the gap still widening: in London, "the average price of flats decreased by 5.0% in the 12 months to August 2026", while house prices rose (ONS, 21 October 2026).
Manchester, Newcastle and Liverpool
Manchester's flats rose 28%, but its houses rose 58%, the most of the 10 cities. In 2019 the median flat there cost slightly more than the median house; now a house costs £48,000 more. Flat sales there fell less (12%) than house sales (23%), which happened in only one other city, Newcastle.
Newcastle upon Tyne has the smallest gap: flats up 21%, houses up 27%, with sales almost unchanged. Liverpool's median flat price rose 33%, but per square metre it fell 5%, so larger flats now make up more of the sales. Its flat sales fell 57%, the steepest drop of the 10 cities.
Across England & Wales the median flat rose 6% and the median house 23%. Zoopla's UK figures show the same split over a longer period: house prices up 43% since 2016 and flats "just over 10%", which it puts down to leasehold worries, service charges and ground rent (Zoopla, 7 July 2026).
What this means for you
- Moving up costs more than it did. If you bought a flat in a big city before 2019, it has most likely gained less than the houses you would move to. In Leicester the gap between the median flat and the median house grew from £57,000 to £123,000.
- Price per square metre is the fairer test. A rise in a flat's median price can just mean bigger flats are selling, as in Liverpool.
- Landlords selling flats face a thinner market. Flat sales fell 24% across England & Wales and by 40% or more in Birmingham, Leicester and Liverpool.
How we did this
We compared every home sold in the 12 months to May 2019, the last clean year before the pandemic, with the 12 months to May 2026 (HM Land Registry, by 2023 local authority; London is its 33 local authorities). Both windows avoid the stamp duty rushes of March 2016 and March 2025. Houses are detached, semi-detached and terraced homes. Later months are left out as many 2026 sales are still being registered, so the falls in sales are partly that lag.
We counted category B sales (repossessions, company and buy-to-let purchases) in both years. Our 2019 data flags very few of them, so leaving them out of 2026 only would overstate the rise. Prices are medians in cash terms, not adjusted for inflation. Price per m² uses the EPC floor area, known for 83% to 98% of sales. Shared ownership part shares are counted. England & Wales only.
Check your area
See what flats and houses sold for near you on the map at trackmystreet.com/uk.
Data
- Price paid data, Jun 2018 to May 2019 and Jun 2025 to May 2026: HM Land Registry (Open Government Licence v3.0)
- Energy Performance Certificates (floor area): Department for Energy Security and Net Zero / MHCLG (Open Government Licence v3.0)
Changes to this article
- 2026-11: first published.