The parts of London bucking the decline in flat prices
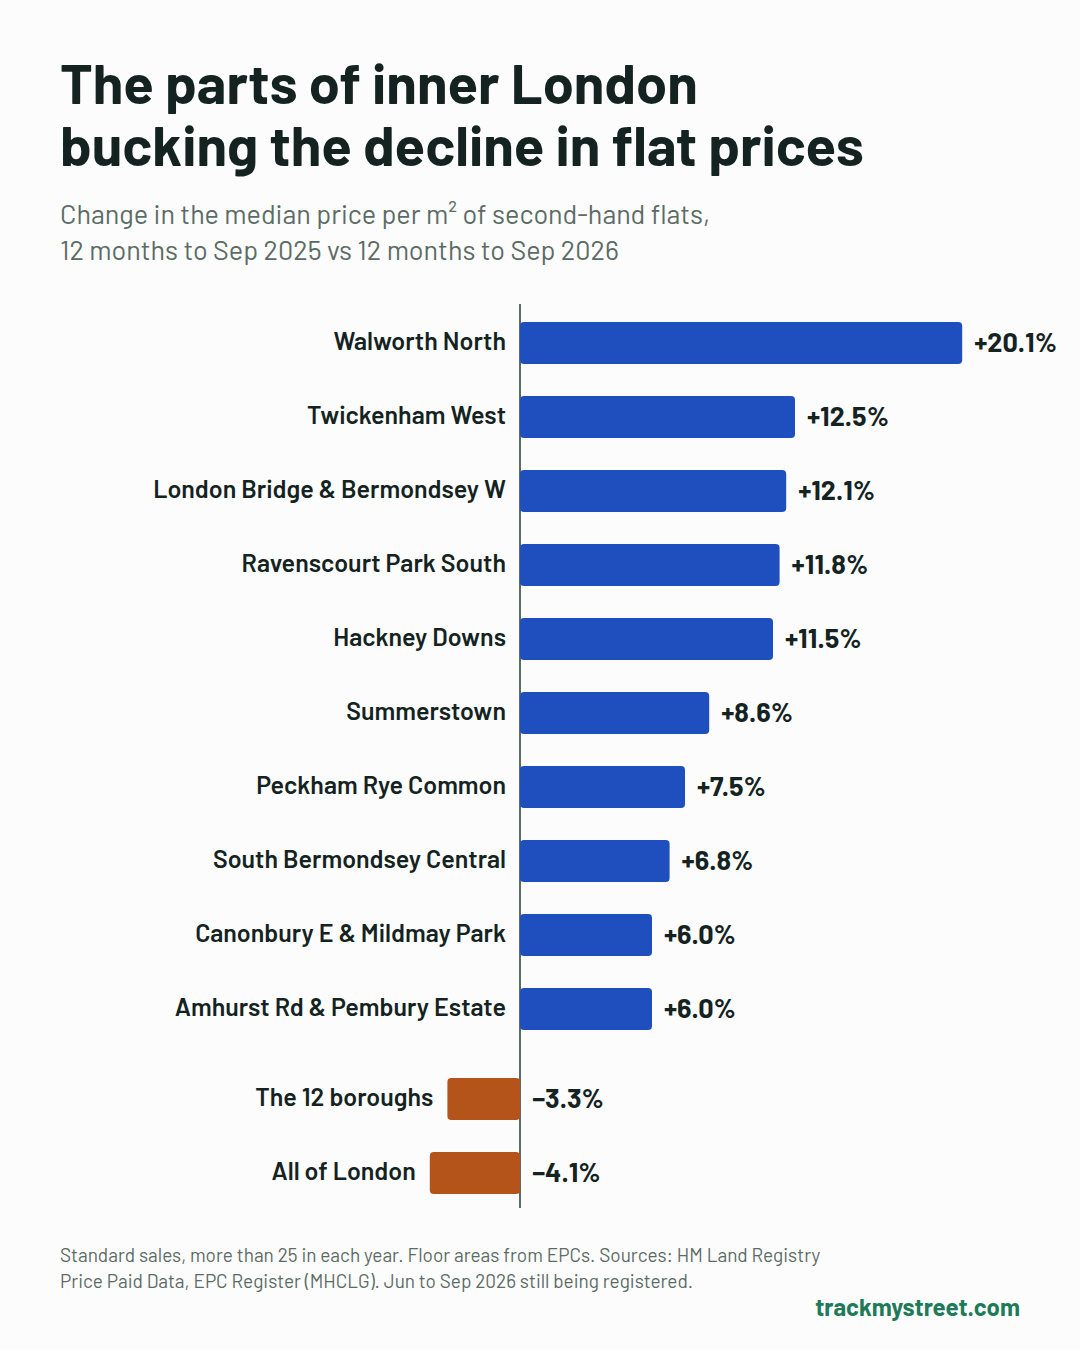
Across 12 inner London boroughs, a square metre of second-hand flat cost 3.3% less in the year to September 2026 than a year earlier. These 10 neighbourhoods went the other way, with rises of 6% to 20%.
Published
A falling market, with exceptions
Flat prices fell across the capital last year. Of the 255 inner London neighbourhoods with enough sales to compare, 178 fell. Even so, a typical second-hand flat in these boroughs still costs about £520,000, or roughly 11 years of a typical London full-time salary.
Six of the 10 have a sizeable park within a five-minute walk of the typical flat. In six, the typical flat sells for under £500,000, the limit for first-time buyers' stamp duty relief. Four have both: Twickenham West, Ravenscourt Park South, Hackney Downs, and Amhurst Road & Pembury Estate. Their typical flat falls inside the relief, with a park on the doorstep.
We rank areas by price per square metre, because a typical price can jump simply when bigger flats happen to sell. Each area below shows both figures. Click a map to explore that neighbourhood with our other map layers, or a heading to open its area report.
1. Walworth North, Southwark
| Year to Sep 2025 | Year to Sep 2026 | Change | |
|---|---|---|---|
| Price per m² | £6,489 | £7,793 | +20.1% |
| Typical flat sold | £380,000 | £485,000 | +27.6% |
| Typical size | 69 m² | 65 m² | −4 m² |
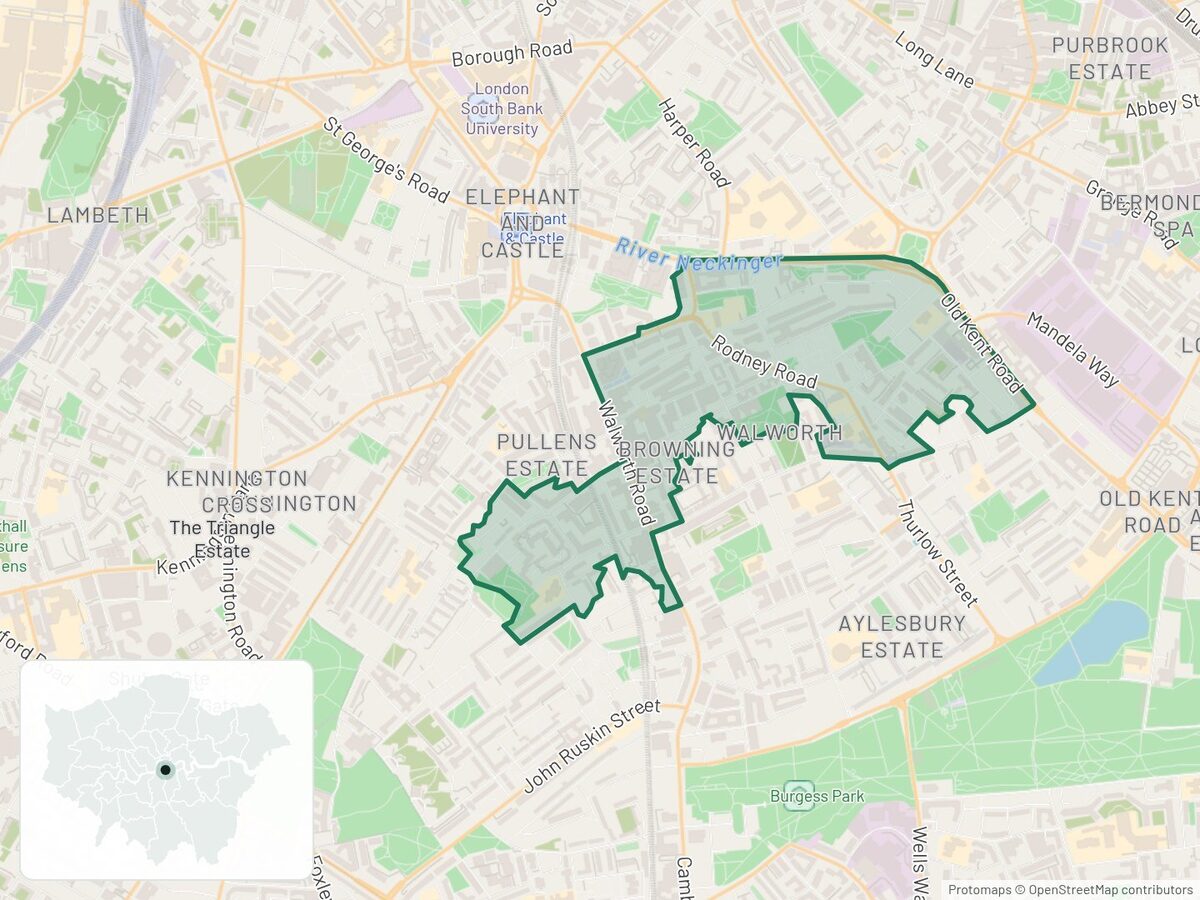
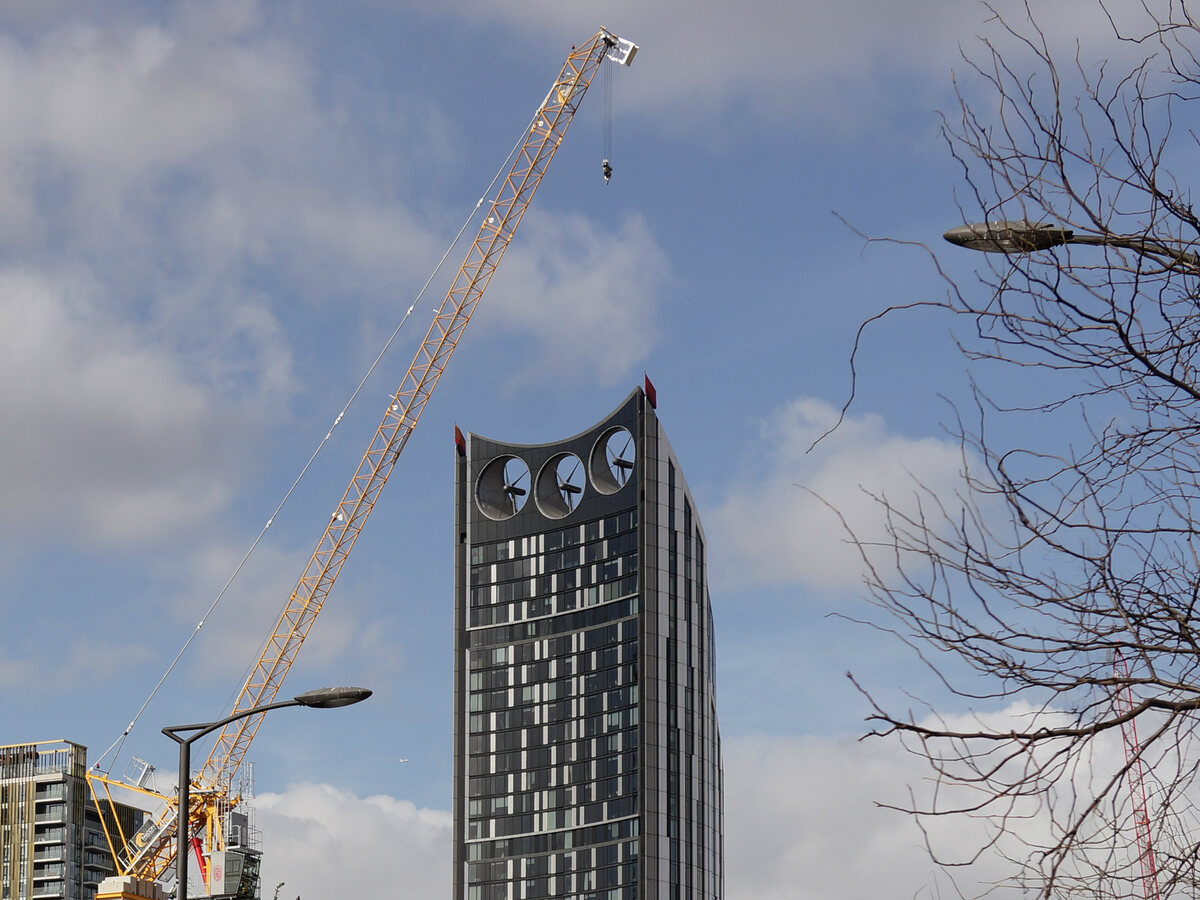
Buyers paid a fifth more per square metre here, and most of that jump is in summer 2026 sales: from October to May the rise is about 4%. Walworth North sits beside the Elephant and Castle regeneration. The last homes at Elephant Park were due for completion in June 2026, and a larger Tube station entrance has been built, with its tunnels due to finish in late 2027. The Bakerloo line extension still has no funding, so don't buy here counting on a new line.
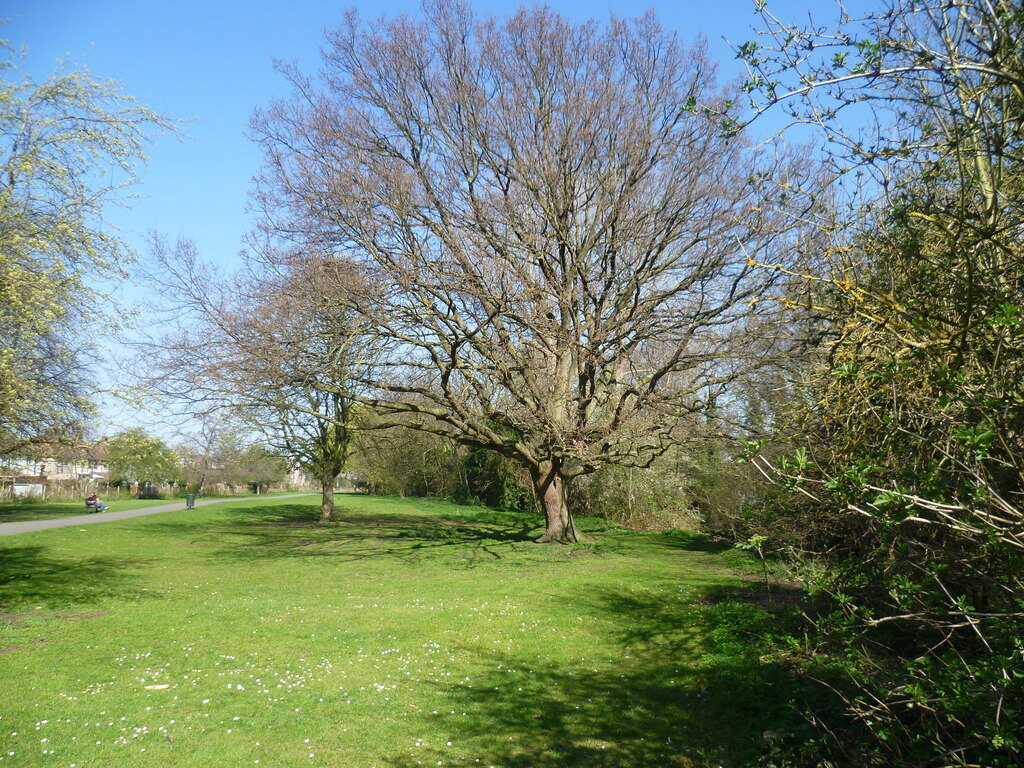
2. Twickenham West, Richmond upon Thames
| Year to Sep 2025 | Year to Sep 2026 | Change | |
|---|---|---|---|
| Price per m² | £6,134 | £6,901 | +12.5% |
| Typical flat sold | £375,000 | £390,000 | +4.0% |
| Typical size | 59 m² | 57 m² | −2 m² |
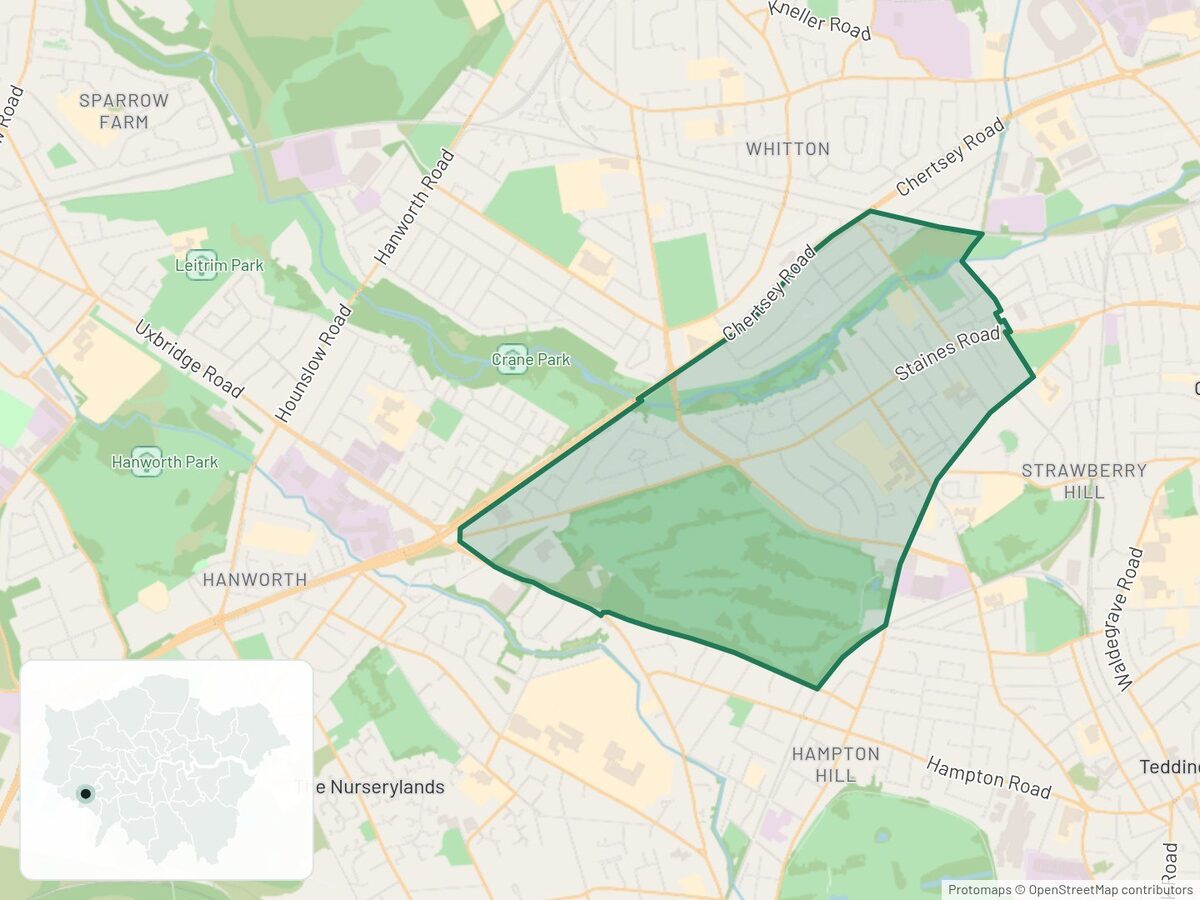
Crane Park, a long green walk beside the River Crane, runs through this quiet corner of Twickenham. Turing House School, about a kilometre north, was graded outstanding in four of five areas in December 2024.
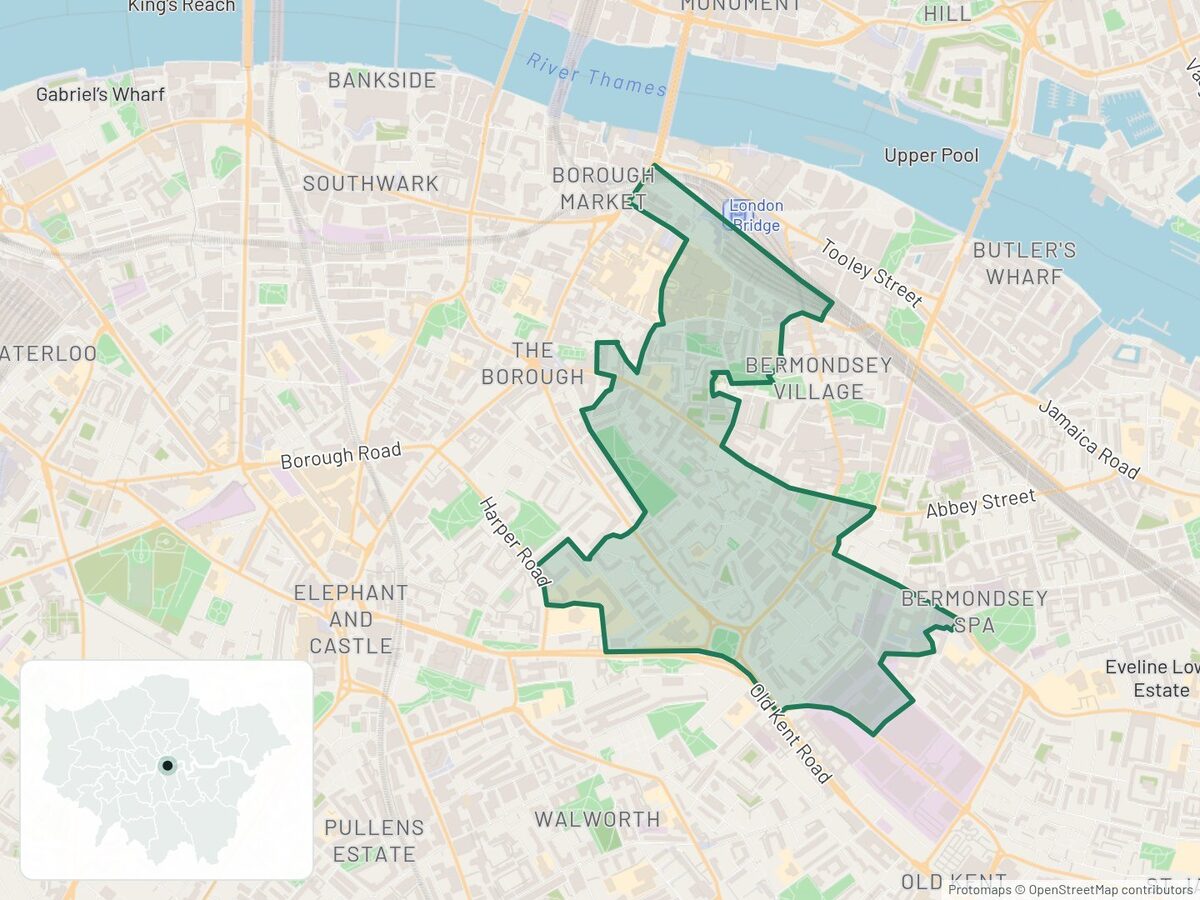
3. London Bridge & Bermondsey West, Southwark
| Year to Sep 2025 | Year to Sep 2026 | Change | |
|---|---|---|---|
| Price per m² | £7,562 | £8,477 | +12.1% |
| Typical flat sold | £450,000 | £550,000 | +22.2% |
| Typical size | 62 m² | 71 m² | +9 m² |
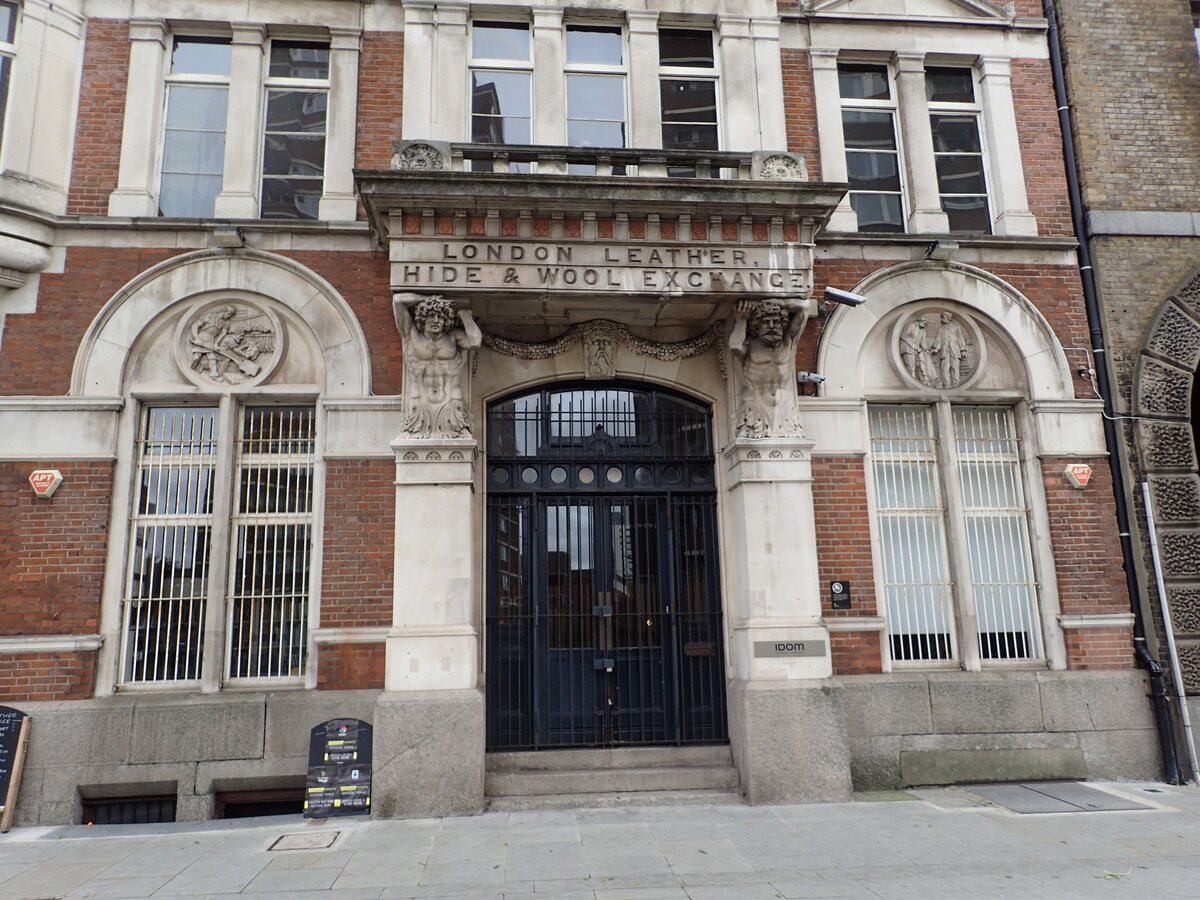
This area runs south from London Bridge station into Bermondsey's old leather trade streets. Two big St Thomas Street schemes are changing it: Chapter London Bridge, nearly finished in January, and EDGE London Bridge, an office tower with a public park planned beside it and completion due in 2026. Bigger flats also sold this year, which is why the typical price rose faster than the price per m².
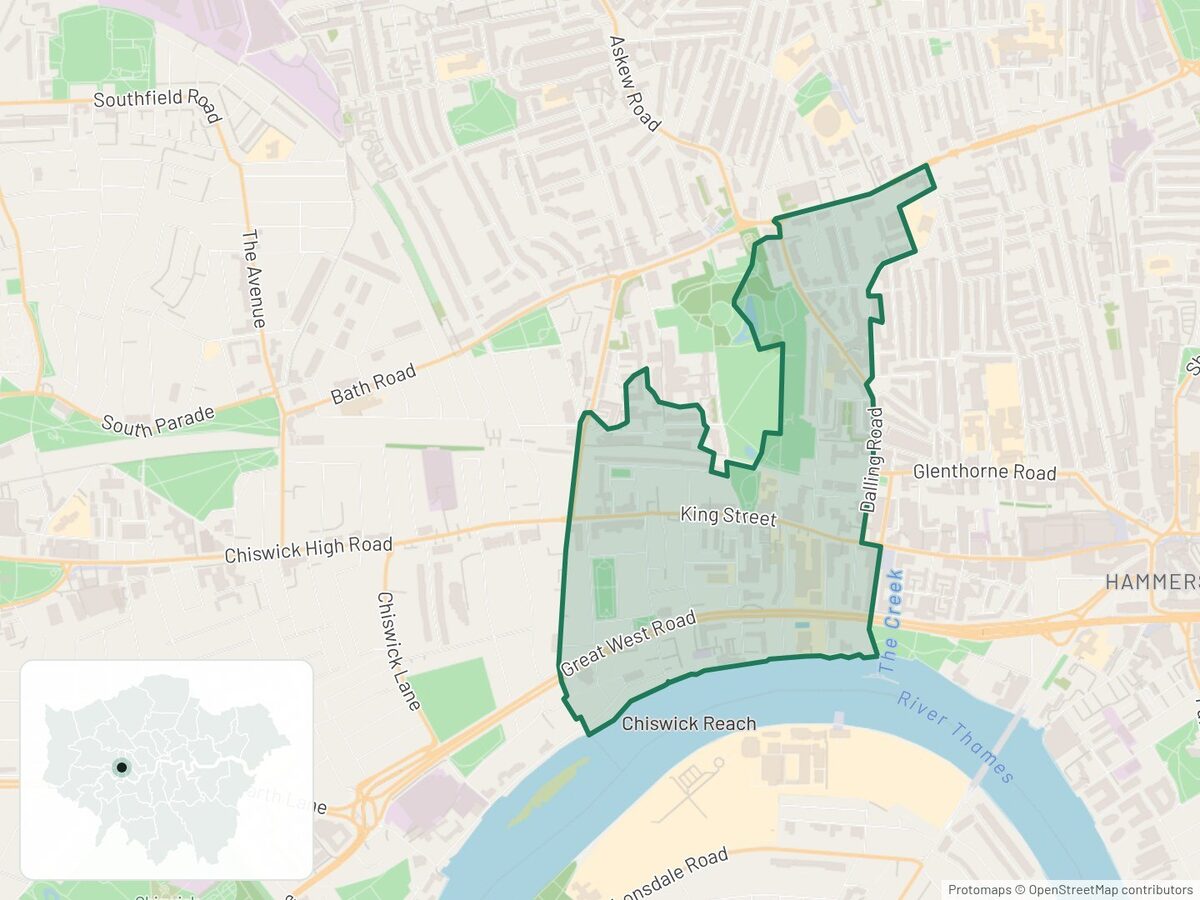
4. Ravenscourt Park South, Hammersmith and Fulham
| Year to Sep 2025 | Year to Sep 2026 | Change | |
|---|---|---|---|
| Price per m² | £8,021 | £8,970 | +11.8% |
| Typical flat sold | £450,000 | £462,000 | +2.7% |
| Typical size | 56 m² | 52 m² | −4 m² |
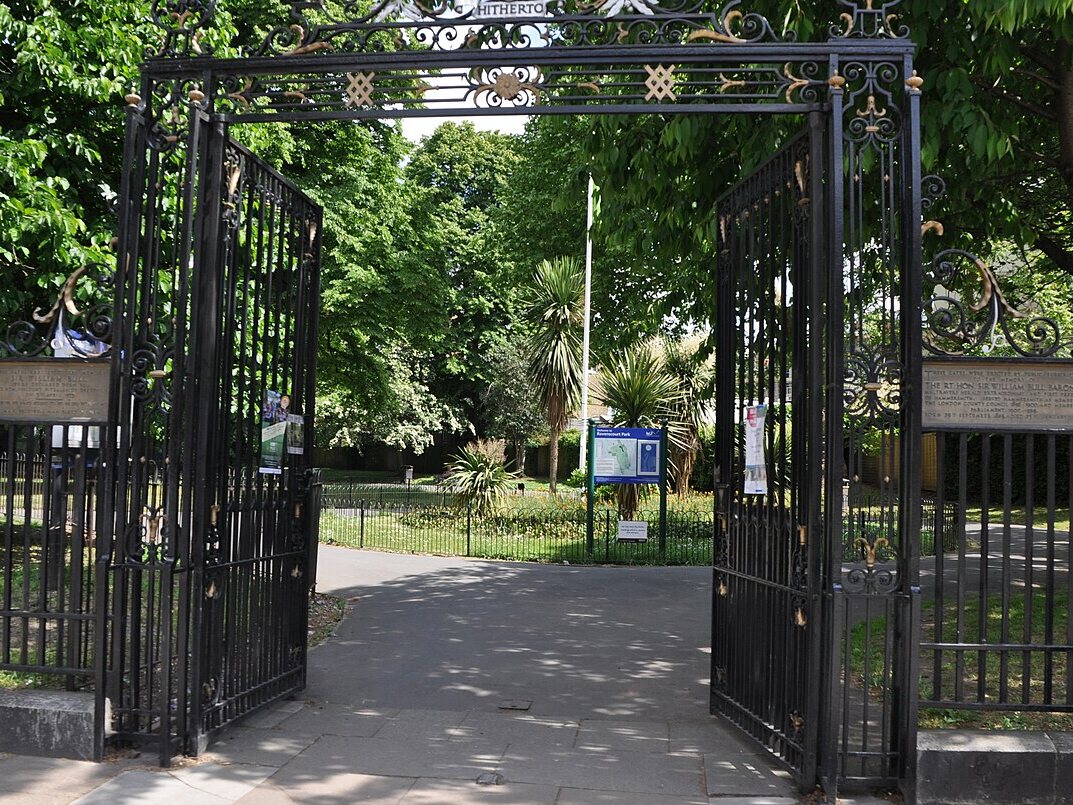
The neighbourhood wraps around its namesake park and has its own Tube station. Just beyond its eastern edge, the Civic Campus on King Street pairs a restored town hall with 204 homes, a public square and a cinema, scheduled to open in phases during 2026. The council is planning new play areas in the park after consulting residents earlier this year.
5. Hackney Downs, Hackney
| Year to Sep 2025 | Year to Sep 2026 | Change | |
|---|---|---|---|
| Price per m² | £8,333 | £9,294 | +11.5% |
| Typical flat sold | £555,000 | £495,000 | −10.8% |
| Typical size | 64 m² | 55 m² | −9 m² |
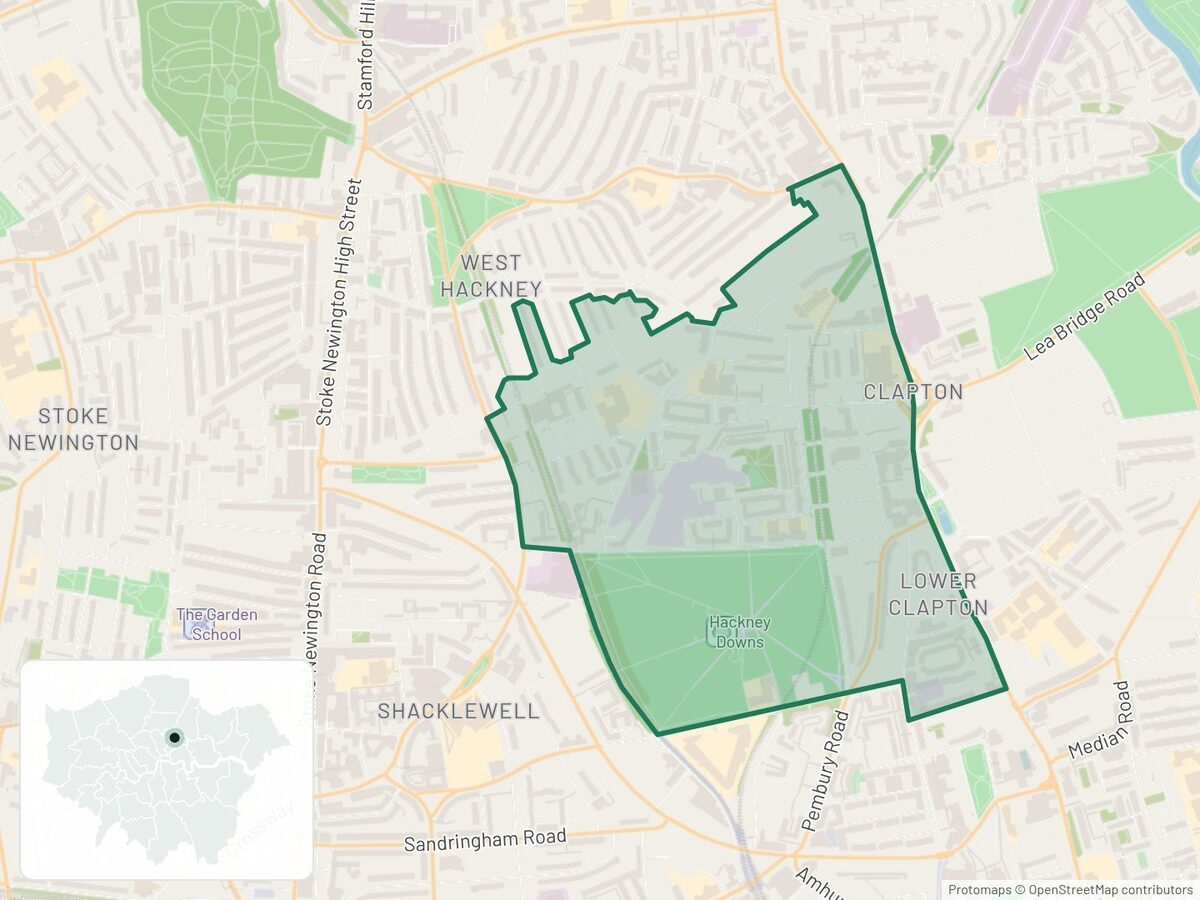
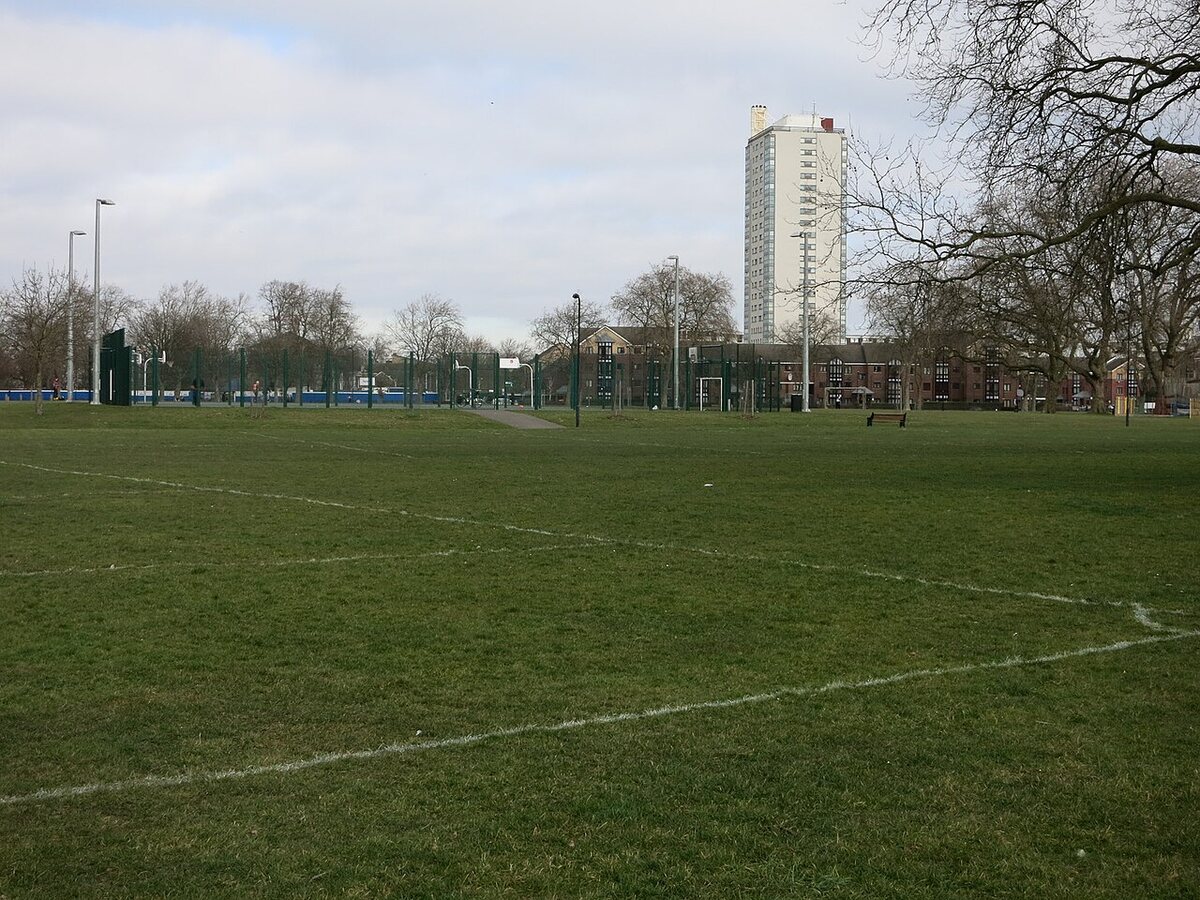
The typical flat sold for less because smaller flats sold this year: the middle size fell from 64 m² to 55 m². Each square metre cost 11.5% more. The area has a Green Flag park, with Rectory Road and Clapton stations close by. The council has approved greener streets and consulted on a café for the park.
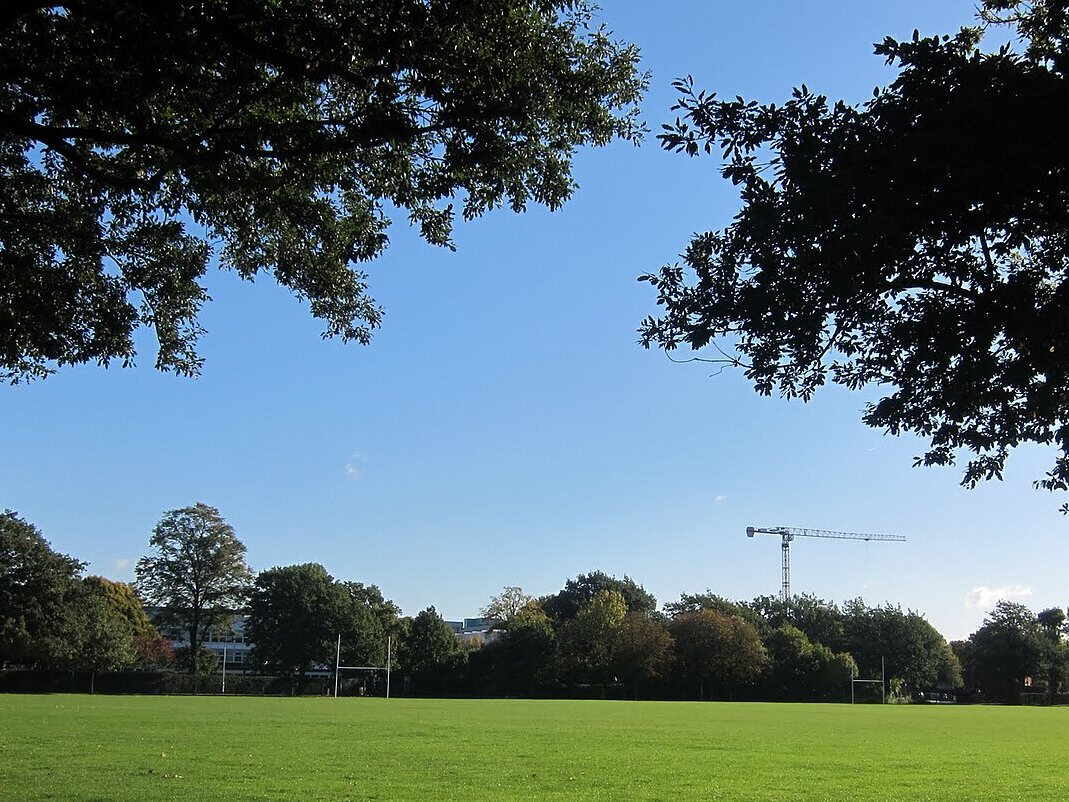
6. Summerstown, Wandsworth
| Year to Sep 2025 | Year to Sep 2026 | Change | |
|---|---|---|---|
| Price per m² | £7,356 | £7,986 | +8.6% |
| Typical flat sold | £470,000 | £650,000 | +38.3% |
| Typical size | 64 m² | 72 m² | +8 m² |
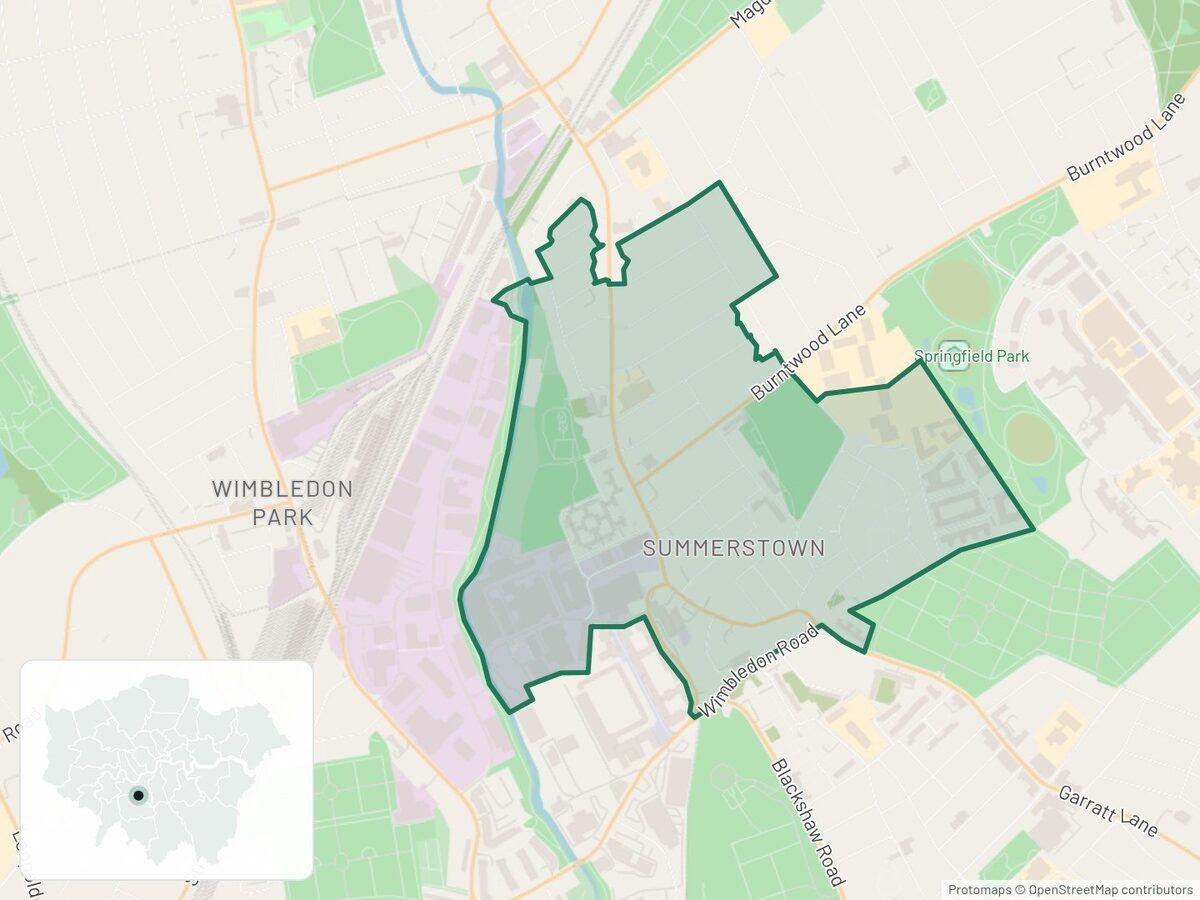
The 38% jump in the typical price is mostly bigger flats selling: the middle size rose from 64 m² to 72 m². Per square metre, flats rose 8.6%. Next door, a 32-acre park opened beside Springfield University Hospital in July 2025, at the centre of a redevelopment of more than 1,200 homes.
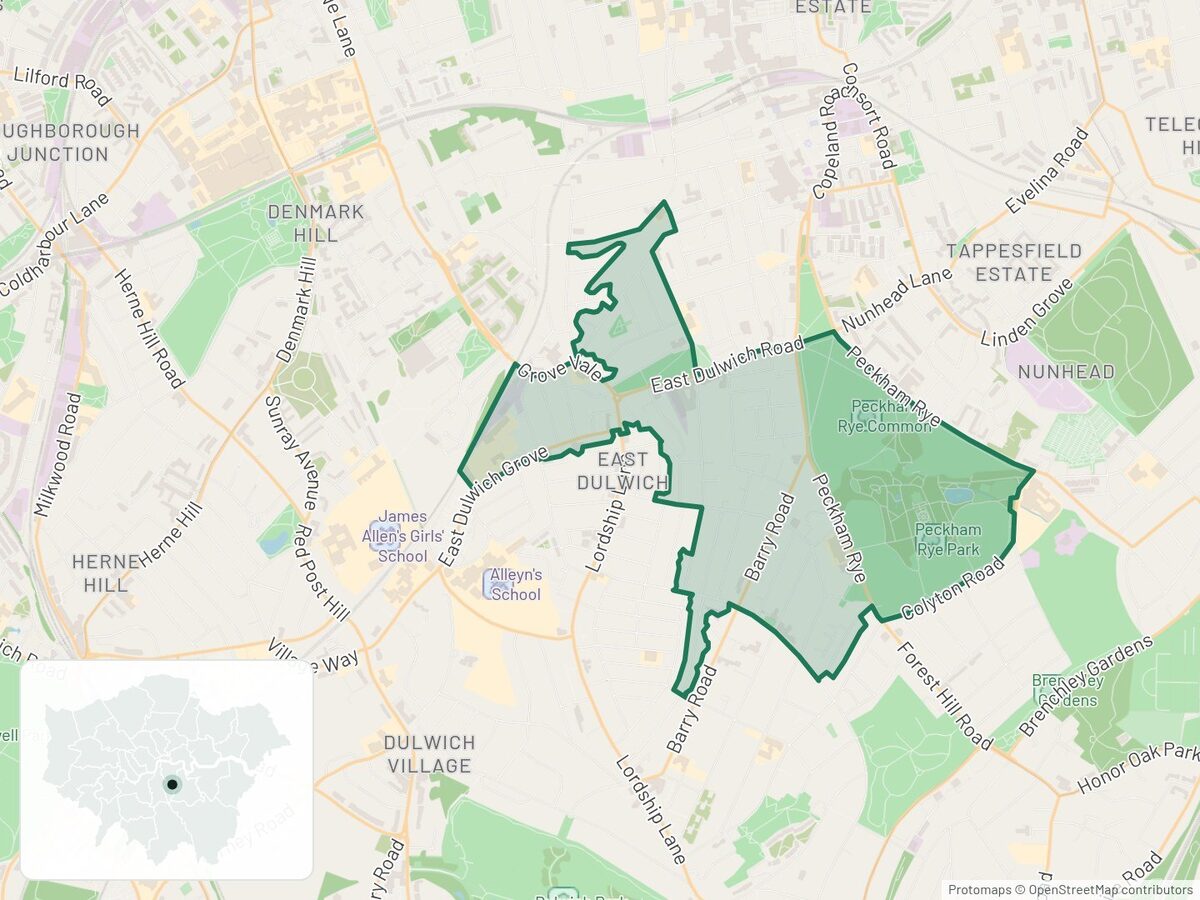
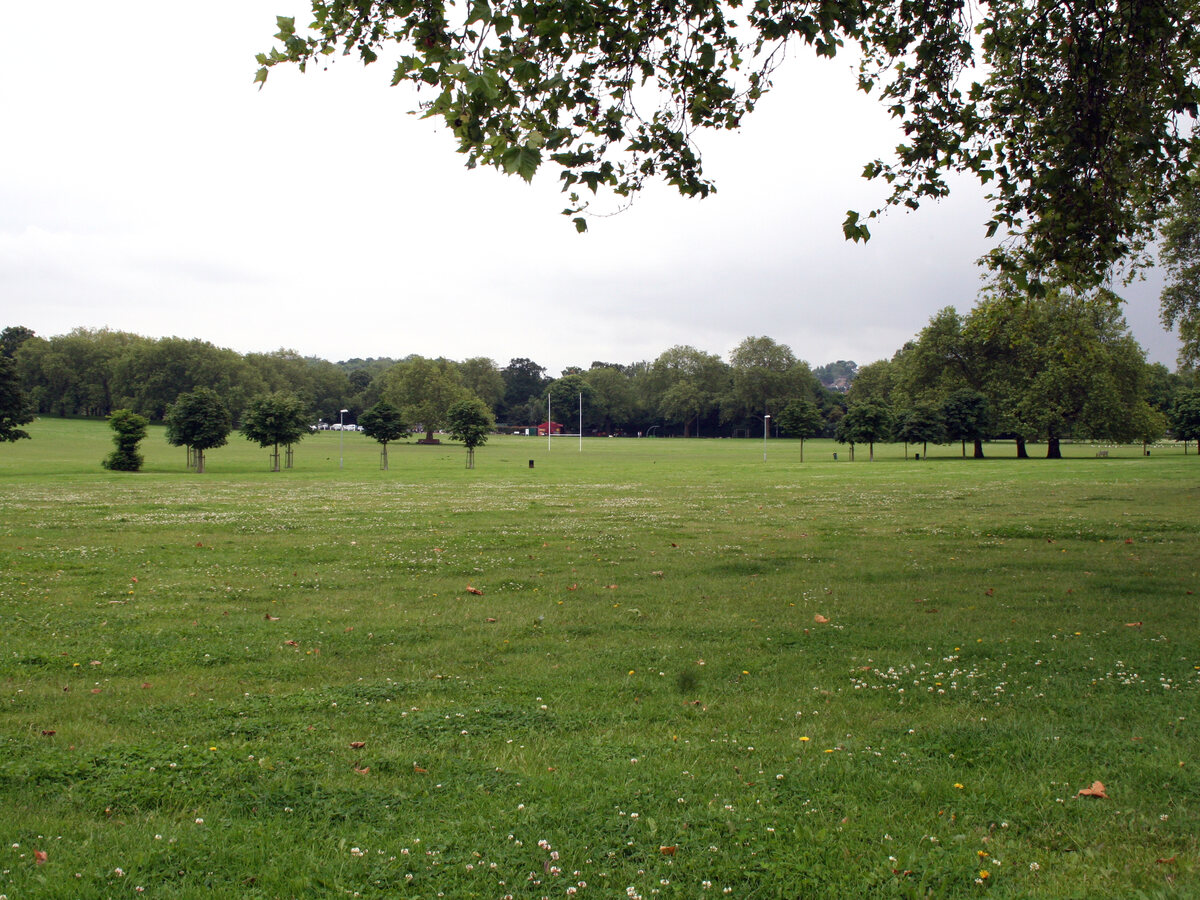
7. Peckham Rye Common, Southwark
| Year to Sep 2025 | Year to Sep 2026 | Change | |
|---|---|---|---|
| Price per m² | £7,977 | £8,579 | +7.5% |
| Typical flat sold | £502,000 | £570,000 | +13.5% |
| Typical size | 63 m² | 62 m² | −1 m² |
This neighbourhood sits around Peckham Rye Park and Common, with their gardens, woodland and lake. Just to the north, Southwark is building a public square outside Peckham Rye station, due to finish in autumn 2027, and the station's ticket gates have been widened.
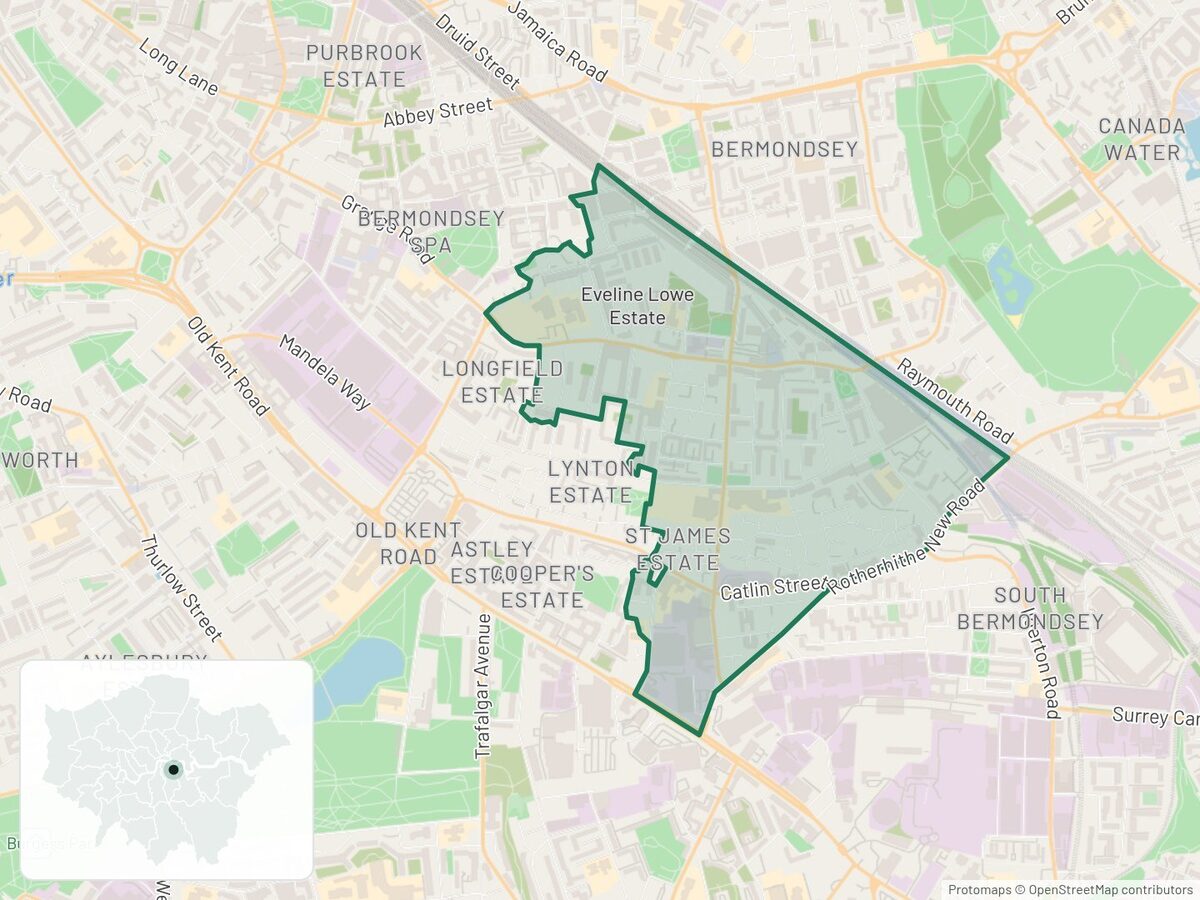
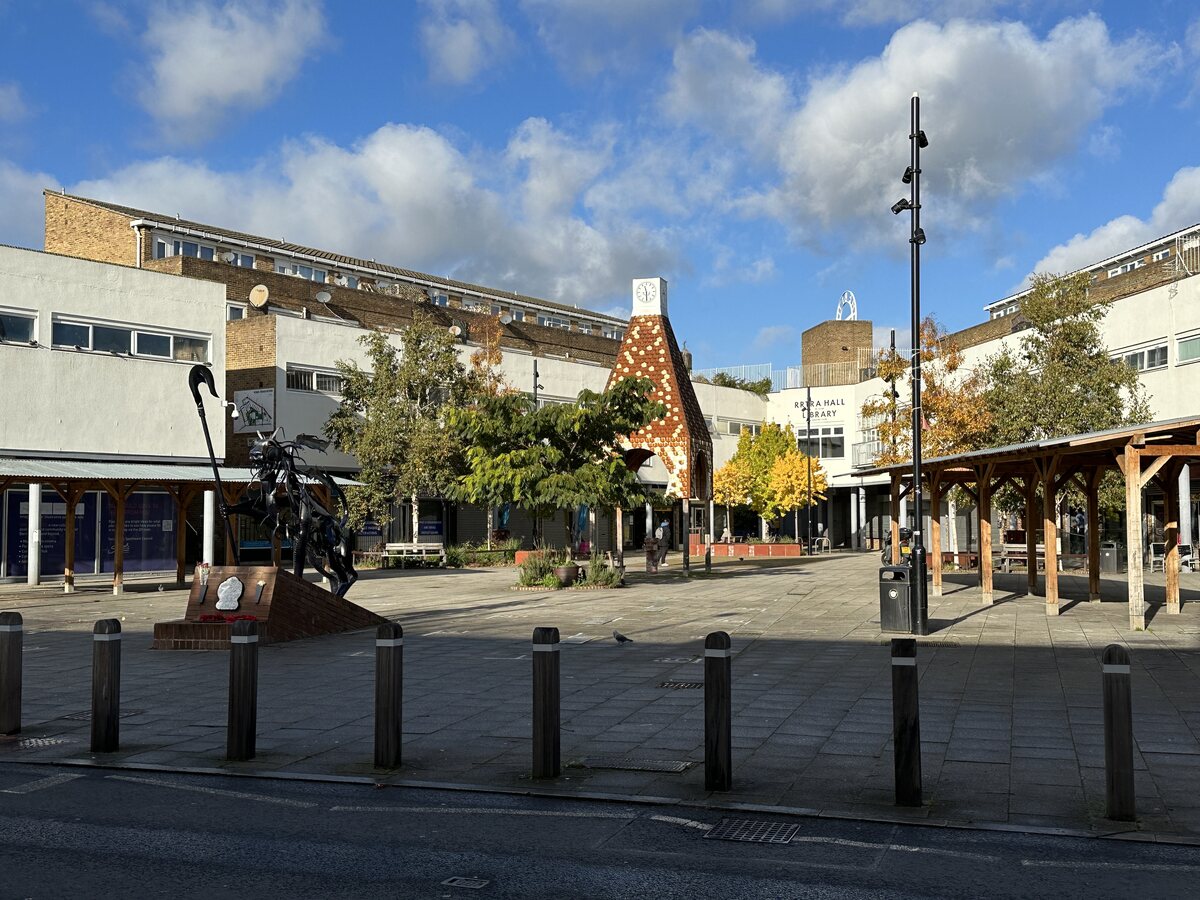
8. South Bermondsey Central, Southwark
| Year to Sep 2025 | Year to Sep 2026 | Change | |
|---|---|---|---|
| Price per m² | £6,273 | £6,702 | +6.8% |
| Typical flat sold | £337,000 | £400,000 | +18.7% |
| Typical size | 56 m² | 64 m² | +8 m² |
Just east of here, the old Peek Freans biscuit factory is becoming Pearl Yard, more than 1,600 rental homes with new streets and public spaces. Its first residents had moved in by February 2026. Those homes are rented, so they are not in these sale prices.
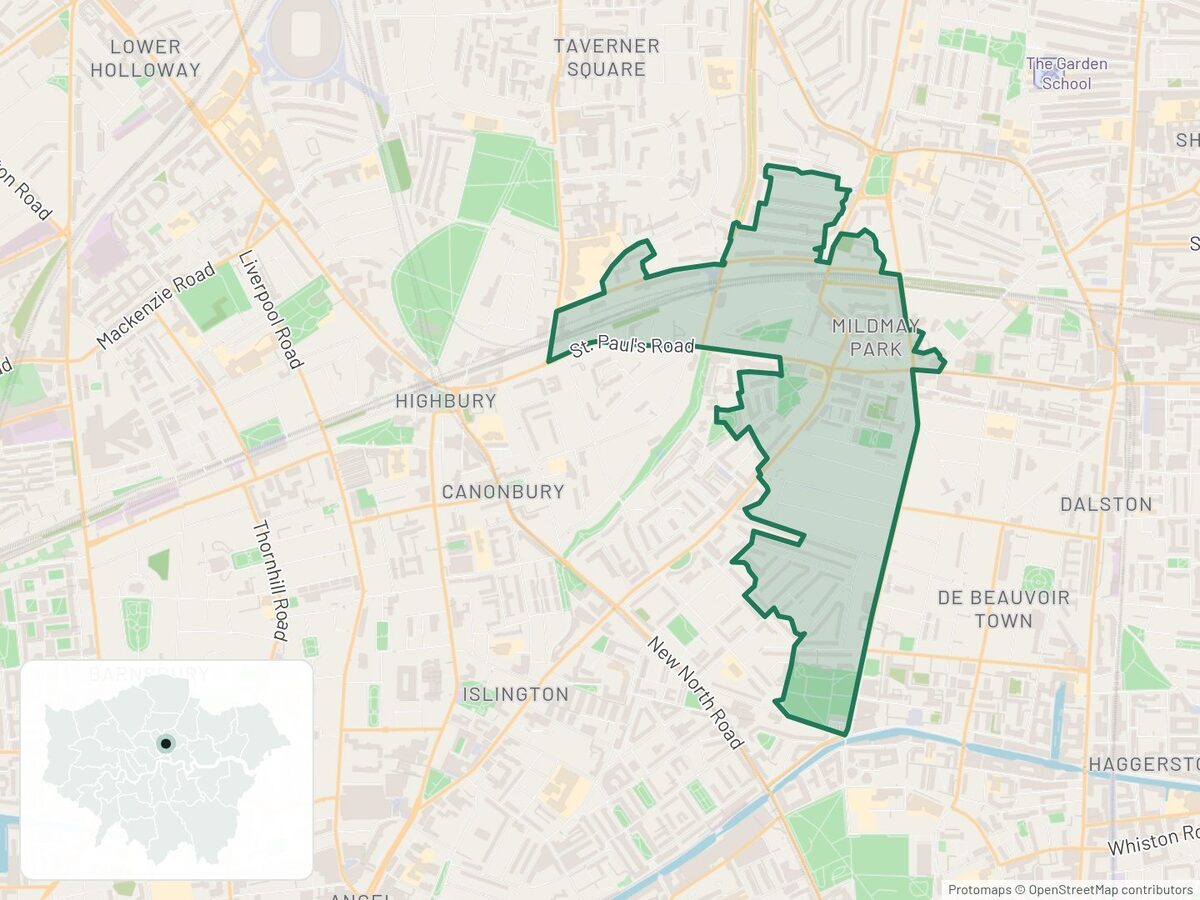
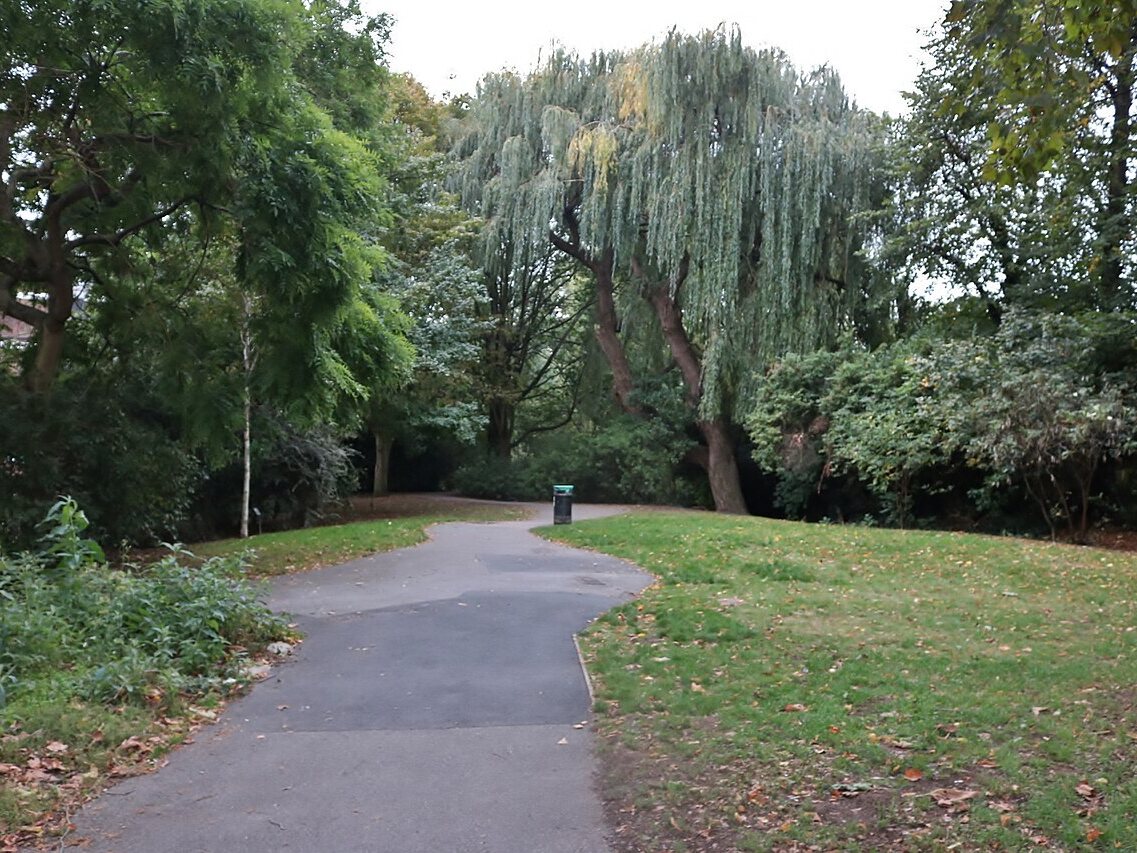
9. Canonbury East & Mildmay Park, Islington
| Year to Sep 2025 | Year to Sep 2026 | Change | |
|---|---|---|---|
| Price per m² | £9,960 | £10,556 | +6.0% |
| Typical flat sold | £600,000 | £630,000 | +5.0% |
| Typical size | 66 m² | 64 m² | −2 m² |
Canonbury station, on the Overground's Mildmay and Windrush lines, is in this neighbourhood. Just to the north-east, Islington's Mildmay Liveable Neighbourhood has reworked Newington Green and added traffic filters since late 2024, giving quieter, greener streets a short walk from the Overground.
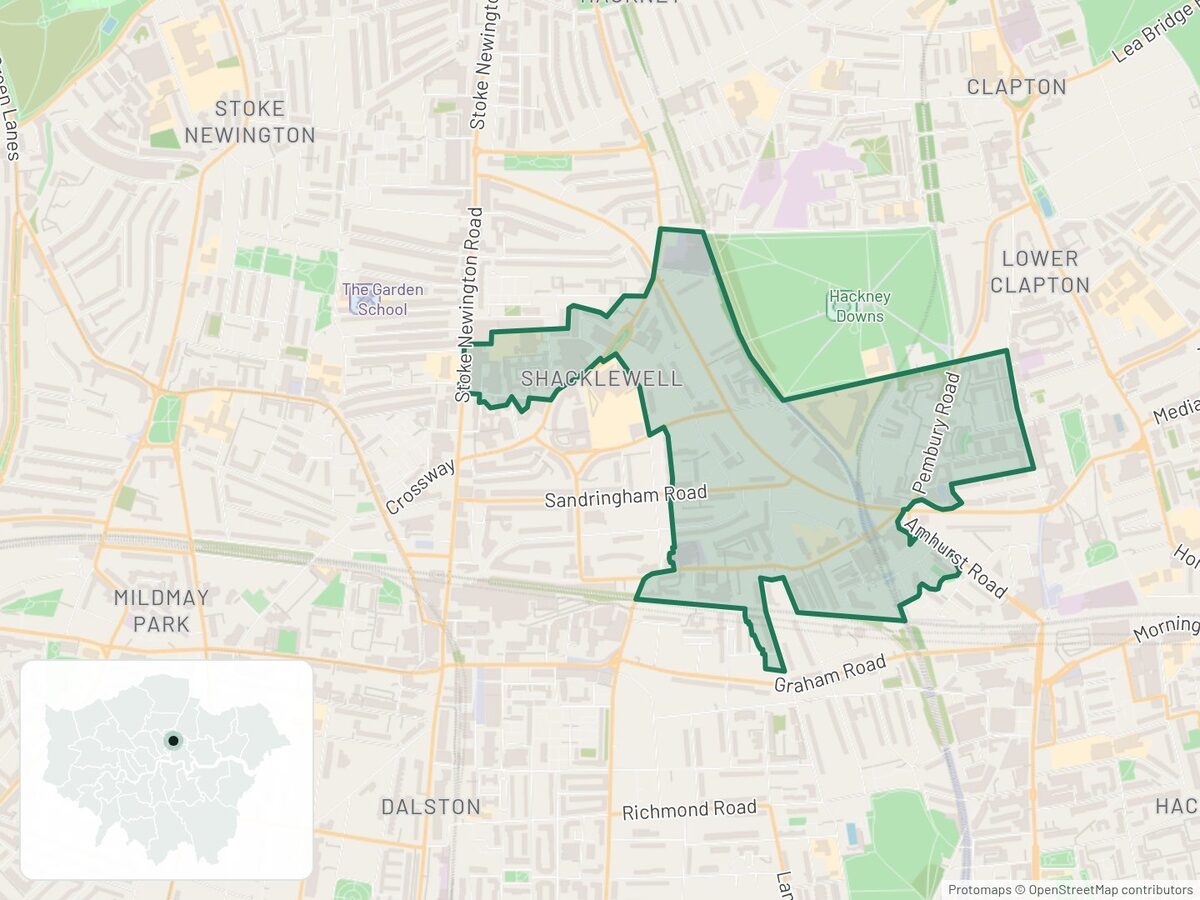
10. Amhurst Road & Pembury Estate, Hackney
| Year to Sep 2025 | Year to Sep 2026 | Change | |
|---|---|---|---|
| Price per m² | £7,865 | £8,333 | +6.0% |
| Typical flat sold | £456,750 | £464,000 | +1.6% |
| Typical size | 58 m² | 61 m² | +3 m² |
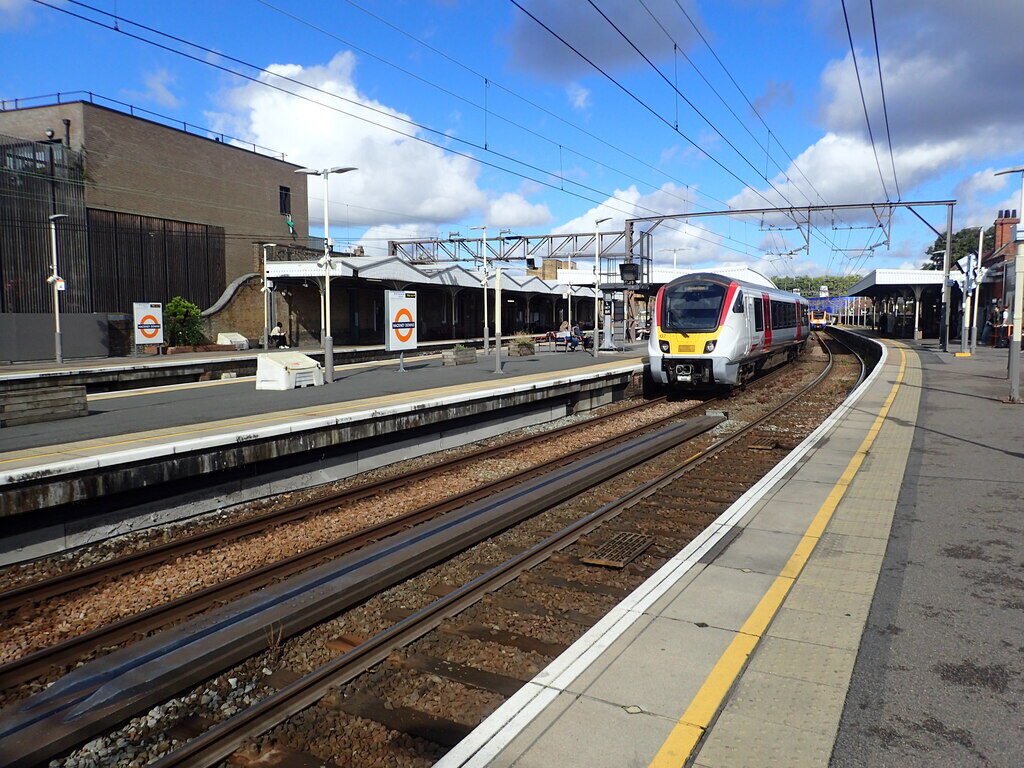
Hackney Downs station is in this neighbourhood and Hackney Central is a short walk away, with a second entrance, opened in 2022, making the change between them more direct. The council is reshaping Amhurst Road and Pembury Circus with a new linear park, eight zebra crossings and less traffic. Road closures for the work began in January 2026.
What this means for you
- First-time buyers. One year's rise is not a promise. These are small markets and most of inner London fell, so use that when you negotiate.
- Compare by size. Ask what a flat costs per square metre, not just its price. Hackney Downs and Summerstown show how far the typical price can mislead.
How we did this
We used HM Land Registry price paid data for second-hand flats (standard sales only, category A) in Hammersmith and Fulham, Kensington and Chelsea, Camden, Hackney, Westminster, City of London, Islington, Tower Hamlets, Southwark, Lambeth, Wandsworth and Richmond upon Thames, called inner London here. Neighbourhoods are 2021 middle layer super output areas (MSOAs), with House of Commons Library names. We compared the median price per m² in October 2024 to September 2025 with October 2025 to September 2026, using floor areas from matched Energy Performance Certificates (86% and 88% of sales). Typical flat sold and typical size are the median price and median floor area; the size comes from the matched certificates, the same sales as the price per m². Each area needed more than 25 sales and 20 matched sales in each year.
The four checks: a 90% resampling interval for the change above zero, and still a rise without March 2025 (the stamp duty rush), on October to May only, and on January to September only. Five areas pass all four. The other five, the closest misses, pass the last three, but their resampling intervals dip just below zero, so with so few sales chance can't be ruled out.
As a test of luck, we shuffled each area's sales across dates and reran the checks 200 times. If every area had simply followed the wider fall, about 2 would pass by chance; 5 did, a result reached in 6% of runs. If prices had not moved at all, about 10 would pass, so no single area is proven.
Caveats: June to September 2026 are still being registered, at 73%, 76%, 52% and 24% of the same months a year earlier, so the latest figures are provisional, and most of Walworth North's rise is in those months. Our copy of October to December 2024 holds about 40% fewer sales than a year later; on January to September alone the 12 boroughs still fell 3.9%. Walking times use straight-line distances from each flat sold in the latest year to the nearest public park of 2 hectares or more (OS Open Greenspace) and the nearest rail, Tube or tram stop (NaPTAN), at 400 m for five minutes and 800 m for ten. Land Registry doesn't record who bought. Shared ownership part shares are included, and flats without an EPC are left out of the price per m².
Check your area
See prices, crime, schools and more for any street on the trackmystreet map.
Data
- Price paid data, Oct 2024 to Sep 2026: HM Land Registry (Open Government Licence v3.0). Contains HM Land Registry data © Crown copyright and database right 2026
- Energy Performance Certificates (floor area): Department for Energy Security and Net Zero / MHCLG (Open Government Licence v3.0)
- Annual Survey of Hours and Earnings, 2025: Office for National Statistics (Open Government Licence v3.0)
- Neighbourhood names: House of Commons Library. Boundaries: ONS (Open Government Licence v3.0)
- Parks: OS Open Greenspace, Ordnance Survey (Open Government Licence v3.0). Stops: NaPTAN, Department for Transport (Open Government Licence v3.0)
- Maps: Protomaps © OpenStreetMap contributors. Photos: credited under each one
Changes to this article
- 2026-11: first published.