Home prices in the North rose 30% since 2019, the South 19%
Since before the pandemic, the median home in the North of England has risen in price half as fast again as in the South outside London, and more than twice as fast as in London. But southern homes started so much higher that the gap in pounds is still growing.
Published
The North West leads England
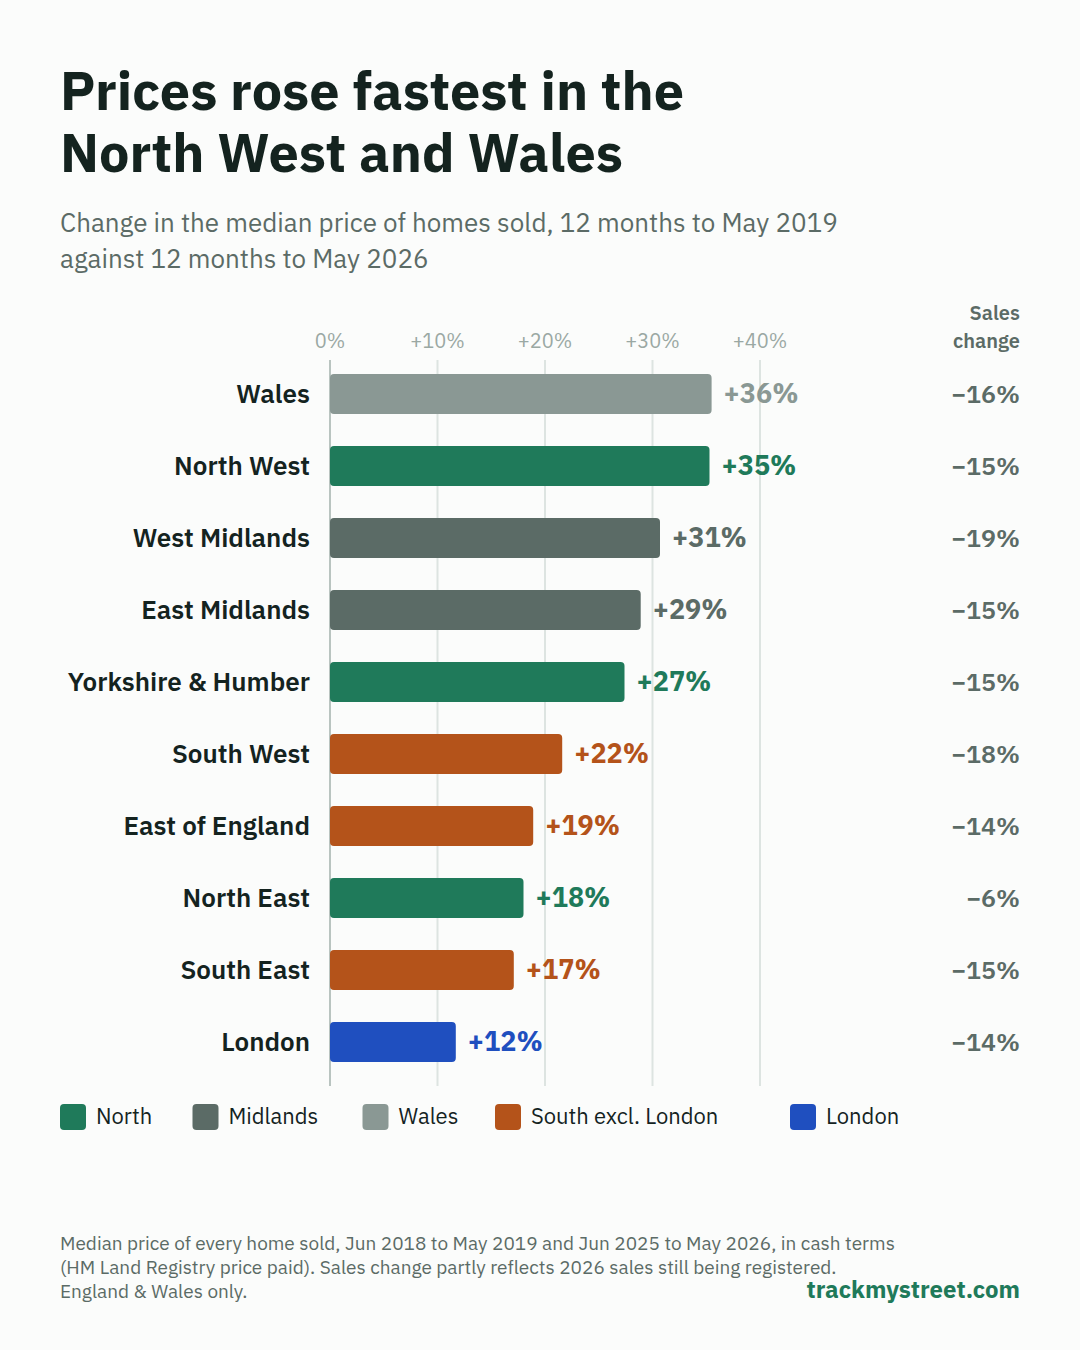
In the 12 months to May 2019 the median home sold in the North West cost £156,000. In the 12 months to May 2026 it cost £211,000, up 35%, the most of any English region. Wales rose slightly more, 36%, to £210,000. Yorkshire and the Humber rose 27% and both Midlands regions 29% to 31%.
Taken together, the North (North East, North West, Yorkshire and the Humber) rose 30%, from £153,000 to £198,000. The South outside London (South East, South West, East of England) rose 19%, from £285,000 to £340,000, and London 12%, from £452,000 to £505,000. Per square metre, which allows for the size of homes, London rose just 8%.
The North East is the exception
The North East rose only 18% over the seven years, to £157,000, slower than the South West (22%) and the East of England (19%). It is still the cheapest region, and its sales held up best: down 6%, against 14% to 19% everywhere else.
The latest year looks different. ONS's index puts the North East at the top, with "the highest house price inflation, at 3.2%, in the 12 months to August 2026", while London prices fell 2.2% (ONS, 21 October 2026).
Faster growth, wider gap
Percentages flatter the North. Its median rose £45,000, while the South's outside London rose £55,000 and London's £53,000. So the gap between the median northern and southern home widened from £132,000 to £142,000, even as the South's median fell from 1.86 to 1.72 times the North's.
Sales fell by similar amounts in both: 14% in the North and 15% in the South outside London. The divide is in prices, not in how many homes change hands.
What this means for you
- Working from home, the North still buys more. The median home in the North West costs £211,000, against £373,000 in the South East.
- Cheap and fast-rising are different things. The North East is cheapest, but over seven years its prices rose less than the South West's. In the latest year, though, it led.
- For reporters: say which gap you mean. The North is catching up in percentage terms but falling further behind in pounds. Both are true.
How we did this
We compared every home sold in the 12 months to May 2019, the last clean year before the pandemic, with the 12 months to May 2026 (HM Land Registry price paid, by region). Both windows avoid the stamp duty rushes of March 2016 and March 2025. Later months are left out as many 2026 sales are still being registered, so the falls in sales are partly that lag.
We counted category B sales (repossessions, company and buy-to-let purchases) in both years, as our 2019 data flags very few of them. Prices are medians in cash terms, not adjusted for inflation, and medians can shift with the mix of homes sold. Price per m² uses the EPC floor area. Shared ownership part shares are counted. England & Wales only: Scotland and Northern Ireland aren't in Land Registry's data.
Check your area
See what homes sold for on your street on the map at trackmystreet.com/uk.
Data
- Price paid data, Jun 2018 to May 2019 and Jun 2025 to May 2026: HM Land Registry (Open Government Licence v3.0)
- Energy Performance Certificates (floor area): Department for Energy Security and Net Zero / MHCLG (Open Government Licence v3.0)
Changes to this article
- 2026-11: first published.