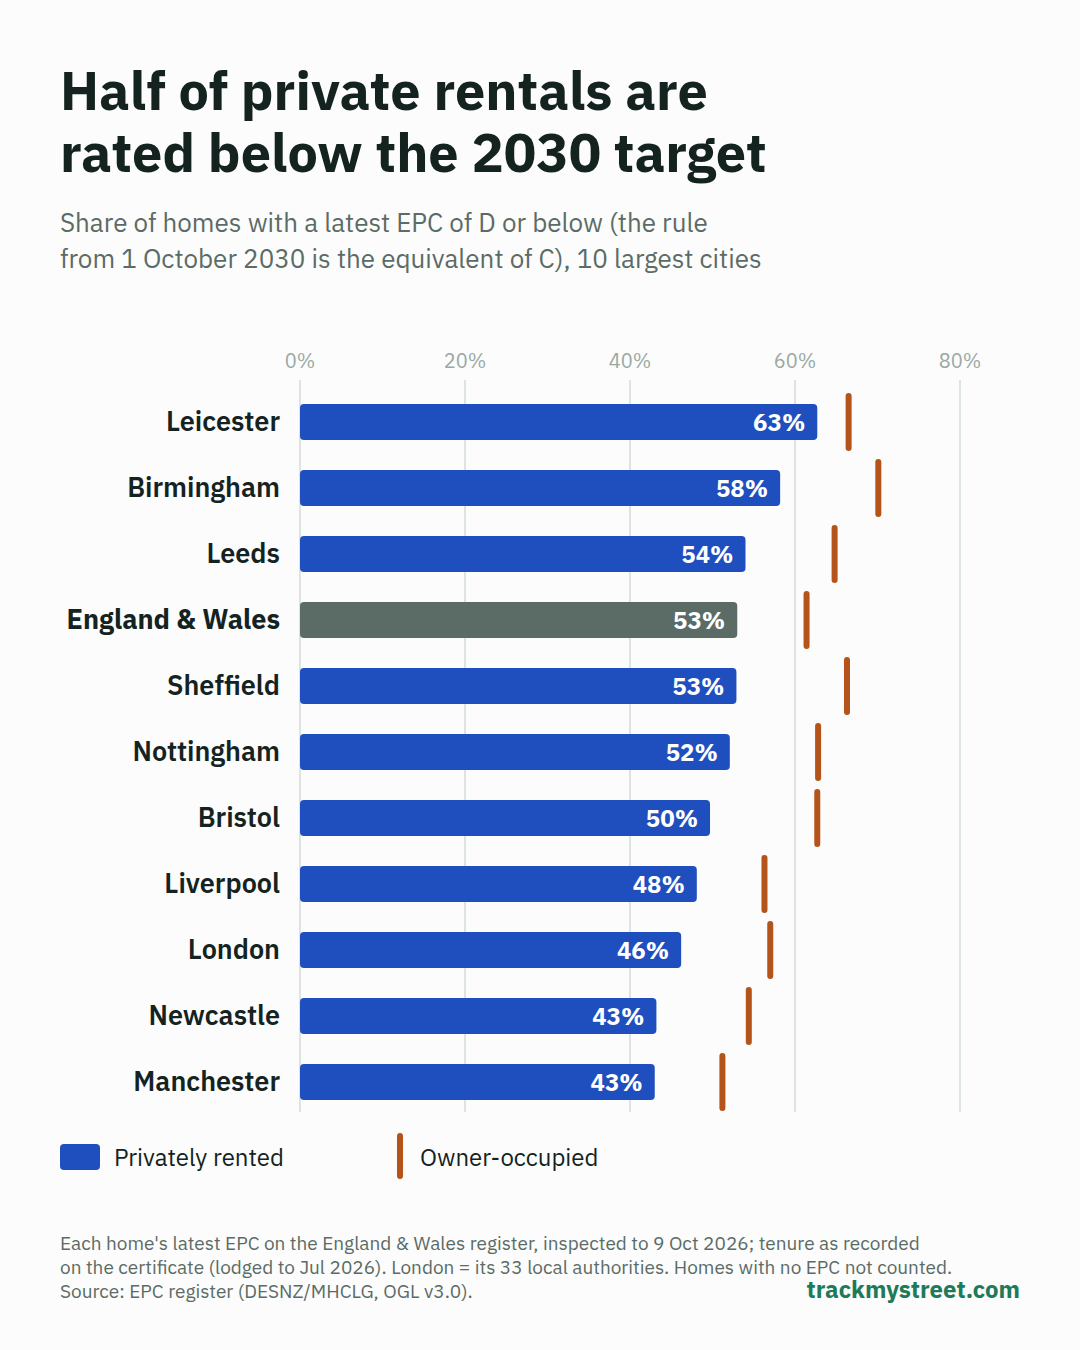
53% of private rentals are rated below the 2030 EPC target
From 1 October 2030, privately rented homes in England & Wales must meet the equivalent of EPC C. On their latest certificate, 53% of the 3.3 million homes recorded as privately rented are rated D or below, about 1.76 million homes.
Published
A deadline, a cost cap and a new kind of certificate
The government confirmed a single compliance date of 1 October 2030 in January 2026. Landlords will spend up to £10,000 a home, or 10% of its value if lower, before they can claim an exemption. A home rated C or above before 1 October 2029 counts as compliant until its certificate expires (GOV.UK, updated 21 January 2026).
The new standard is measured on reformed EPCs, starting with the building's fabric, so today's rating is a guide, not a verdict. The government's own modelling puts "just under 50%" of private rented homes below its fabric standard (impact assessment, updated 21 January 2026), close to our 53%.
Leicester and Birmingham have the most to do
Of the 10 largest cities, Leicester has the highest share of private rentals rated D or below: 62.7% of 24,146 homes. Birmingham is next at 58.2%, then Leeds (54.0%) and Sheffield (52.9%). Manchester (43.0%) and Newcastle upon Tyne (43.2%) have the lowest shares. Very poor ratings are rare: 1.3% of private rentals across England & Wales are F or G.
London: lowest in the inner east
Across London's 33 boroughs, 46.2% of private rentals are rated D or below. Tower Hamlets has the lowest share: 23.8% of 38,490 homes. Hackney (35.3%) and Southwark (35.6%) follow. Seven outer boroughs sit above the England & Wales figure, with Enfield highest at 55.8%.
Rentals look better because more of them are flats
Owner-occupied homes do worse than rentals: 61.4% are rated D or below. But 46.9% of private rentals are flats or maisonettes, against 15.4% of owner-occupied homes, and flats are rated better: 40.0% of privately rented flats are D or below, against 62.5% of privately rented houses. Like for like the gap closes. Privately rented houses are slightly better than owner-occupied ones (62.5% against 64.7%), and privately rented flats are worse (40.0% against 33.7%).
What this means for you
- Check the certificate date. A home rated C before 1 October 2029 counts until that EPC expires. Homes rated D sit closest to the line.
- Houses are where the work is. Six in ten privately rented houses are D or below, and the £10,000 cap is per home.
- Your homes matter more than your city. A privately rented flat is far likelier to be rated C or above than a house. Look up each home's rating rather than the local average.
How we did this
We took the latest EPC for every home (UPRN) on the register, inspected up to 9 October 2026, and its tenure from the certificate's own tenure field, lodged up to 2 July 2026. Areas come from the certificate's postcode, inside 2025 local authority boundaries. "D or below" means a current rating of D, E, F or G.
Tenure is as recorded on the date of each certificate, so a home let since its last EPC counts under its old tenure. That is why only 3.3 million homes are recorded as privately rented, against the government's estimate of about 5.1 million. Homes with no certificate aren't counted, and 2.3 million certificates have no tenure. 10.8% of the private rentals' certificates are over 10 years old; counting only newer ones, the share is 50.3%. Scotland and Northern Ireland have their own registers and aren't included.
Check your area
See the energy ratings of homes on your street on the map at trackmystreet.com/uk.
Data
- Energy Performance Certificates, England & Wales, inspected to Oct 2026 (tenure lodged to Jul 2026): Department for Energy Security and Net Zero / MHCLG (Open Government Licence v3.0)
- ONS Postcode Directory: Office for National Statistics (Open Government Licence v3.0)
- Local authority boundaries 2025: Office for National Statistics (Open Government Licence v3.0)
Changes to this article
- 2026-11: first published.