Rents outran pay in all 10 big cities, by most in Nottingham
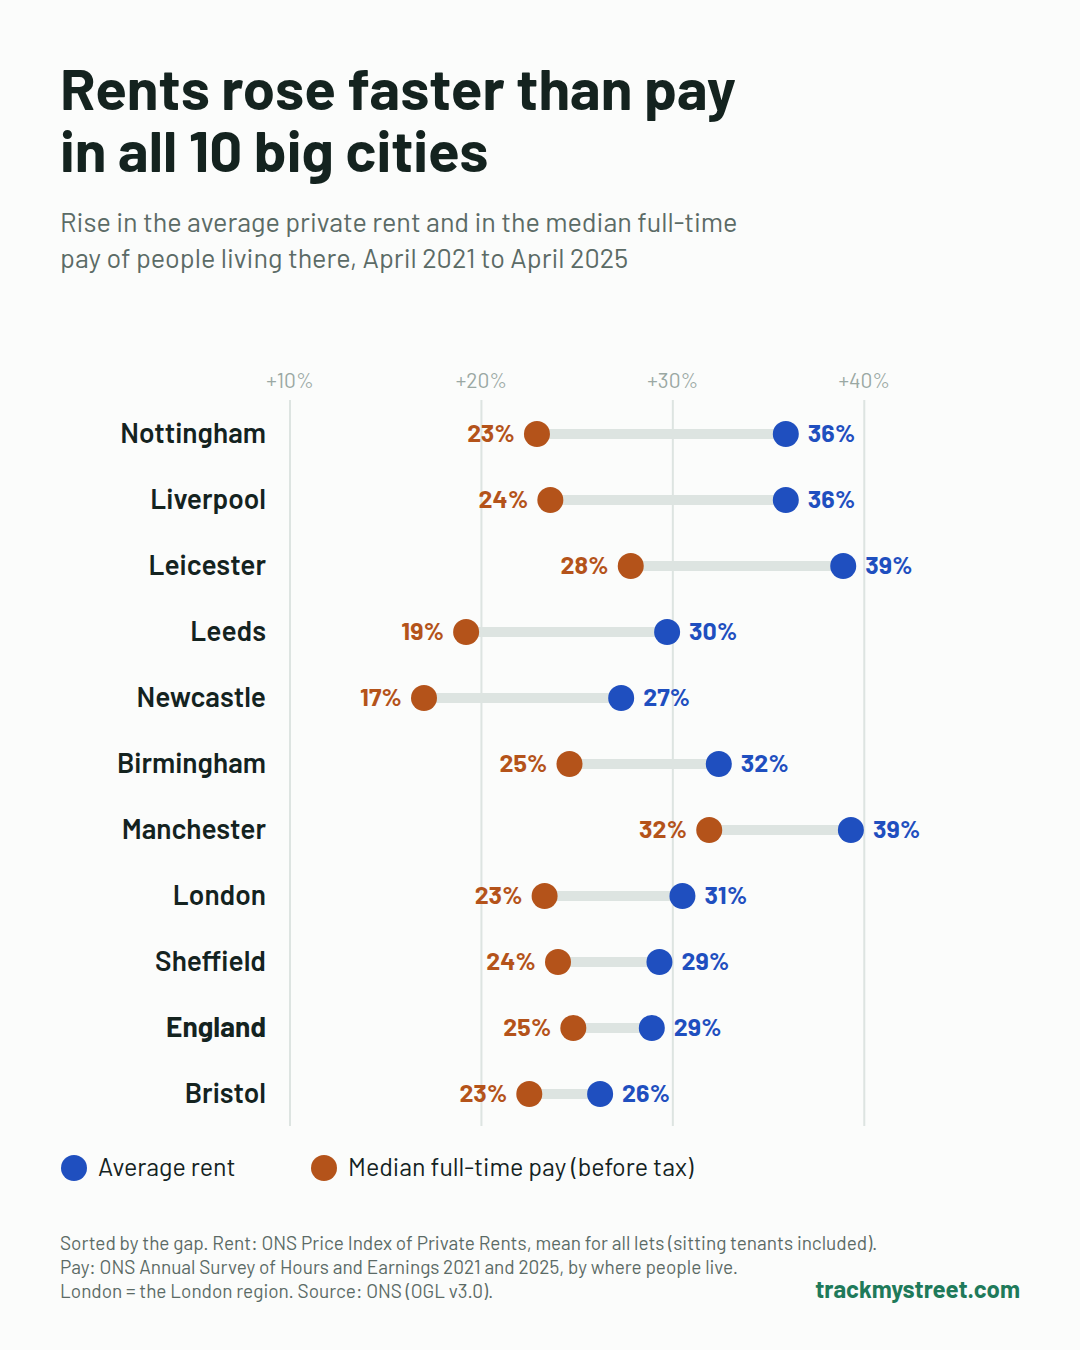
Between April 2021 and April 2025, the average private rent rose faster than full-time pay in every one of England's 10 largest cities. The gap was widest in Nottingham, where rents rose 36% and the pay of people living there 23%.
Published
Nottingham: two more weeks' pay a year on rent
Take someone on the typical full-time salary in Nottingham, renting an average home. In 2021 a year's rent cost them about 18 weeks' pay before tax. By 2025 it was nearly 20 weeks.
That is the biggest rise of the 10 cities. Rent went up by about a third, while pay went up by under a quarter. The average rent has kept climbing since, to about £1,010 a month in August 2026.
Liverpool, Leeds and Newcastle: the same story, from a lower base
Liverpool's rents rose as fast as Nottingham's, also 36%. But they started low, so a year's rent still costs only about 14 weeks of a typical local salary, the least of the big cities with Sheffield.
In Leeds and Newcastle upon Tyne, rents rose about 10 percentage points faster than pay. Both now take about 19 weeks' pay a year, up from 17.
Manchester rose most, but pay kept closer
Manchester's average rent rose the most of any big city, by 39%. Pay there also rose fastest, by about 32%, so the gap was smaller than in Nottingham or Leeds.
Even so, a year's rent in Manchester takes about 22 weeks' pay, more than anywhere in the list except Bristol and London.
| Rent for a year, in weeks of typical full-time pay | 2021 | 2025 |
|---|---|---|
| London | 28.5 | 30.2 |
| Bristol | 26.8 | 27.6 |
| Manchester | 21.3 | 22.5 |
| Nottingham | 17.8 | 19.7 |
| Liverpool | 12.9 | 14.2 |
London and Bristol: dearest, but the gap is narrower
In London, a year's average rent costs about 30 weeks of a typical full-time salary, well over half of what a worker earns before tax. In Bristol it is about 28 weeks.
But in Bristol rents and pay rose almost in step: 26% against 23%. It and Sheffield had the smallest gaps of the 10 cities.
Rents are still rising. The ONS put the average UK rent at £1,406 a month in September 2026, up 3.8% in a year, with the North West rising fastest of England's regions at 5.7% (ONS, 21 October 2026).
What this means for you
- Moving for a job? Compare the rent with local pay, not just with your old city. Liverpool and Sheffield rents take about half the share of pay that Bristol's or London's do.
- Saving for a deposit while renting? In pounds, typical pay rose more than the average rent in every city. But that pay rise is before tax, so the rise in take-home pay is smaller, and in Nottingham, Leeds and Newcastle rent has taken a bigger bite of it.
How we did this
We compared ONS's average (mean) monthly private rent for all lets, by council area, in April 2021 and April 2025 with ONS's median gross annual pay of full-time employees living in the same area in 2021 and 2025 (the Annual Survey of Hours and Earnings, whose reference month is April; "typical" pay means this median). London is the London region for both. Weeks of pay = a year's rent ÷ (annual pay ÷ 52). Nottingham's rent rose 35.9% and its pay 22.9%; England's 28.9% and 24.8%.
The rents include sitting tenants, so they are below the asking rents on new lets, and rise more slowly. Pay is for everyone living in the area, not only renters, and is before tax. Rents are for 2025 council areas and pay for 2023 ones, which match for these cities.
Check your area
See rents, prices and pay for your own area on the map at trackmystreet.com/uk.
Data
- Price Index of Private Rents, April 2021 to August 2026: Office for National Statistics (Open Government Licence v3.0)
- Annual Survey of Hours and Earnings, 2021 and 2025, resident analysis: Office for National Statistics, via Nomis (Open Government Licence v3.0)
Changes to this article
- 2026-11: first published.