Countryside home prices rose 33% to 2023, then slipped 6%
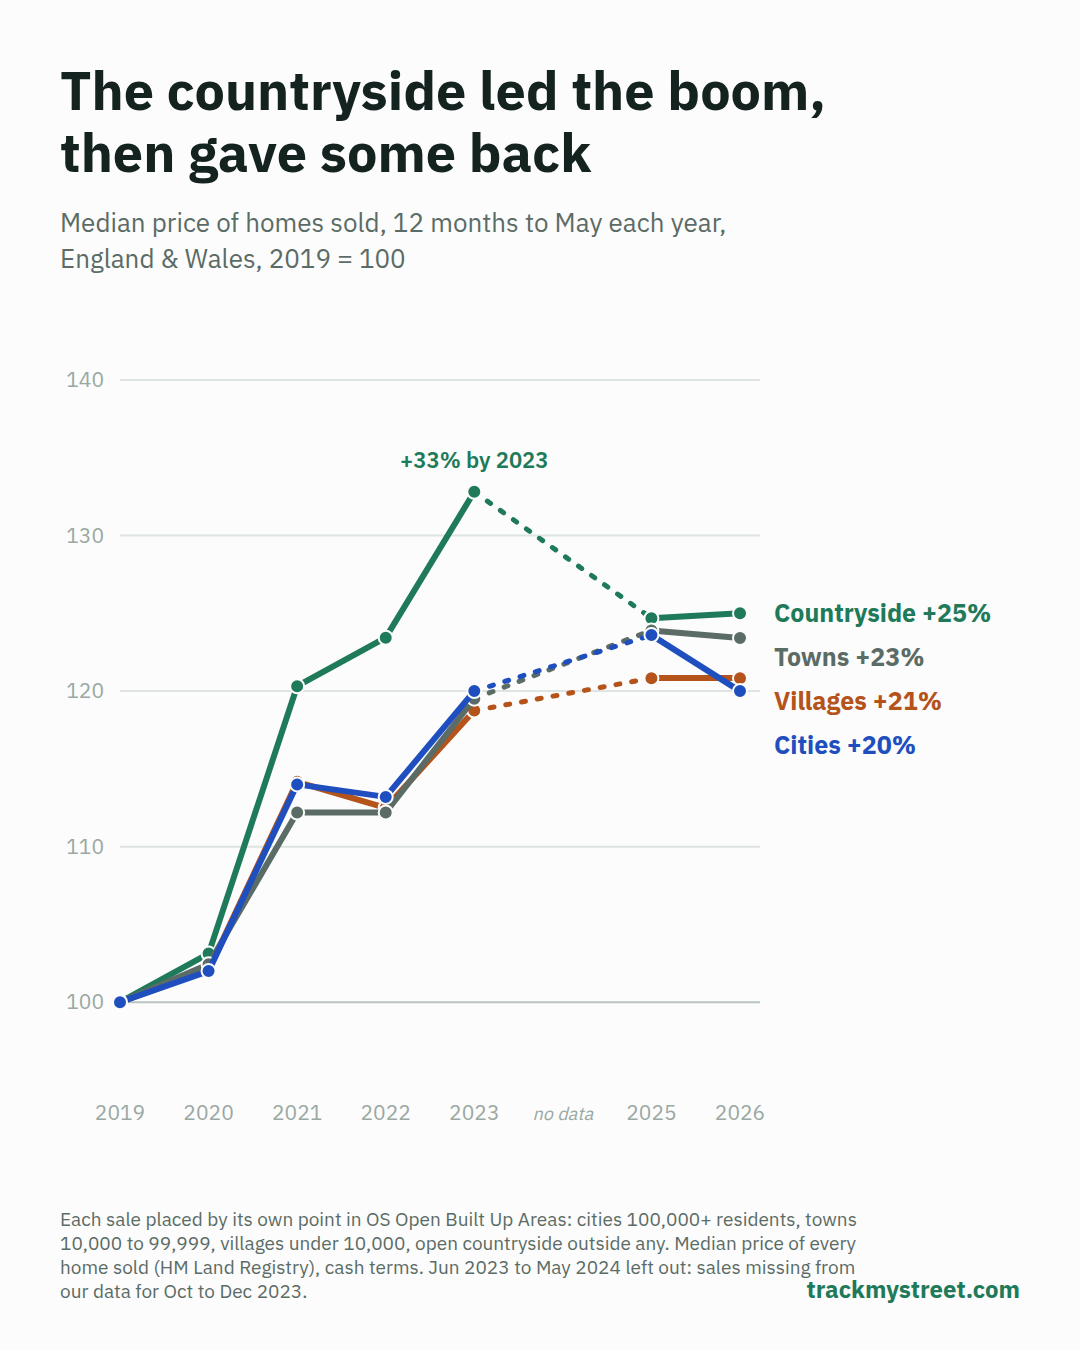
Homes in hamlets and open countryside led the pandemic's race for space in England & Wales: their median price rose a third between 2019 and 2023. Since then they have slipped back, while prices in cities, towns and villages held level, so more than half of the countryside's lead over cities has gone.
Published
The surge: 2019 to 2023
In the 12 months to May 2019 the median home sold outside any built-up area cost £320,000. By the 12 months to May 2023 it cost £425,000, up 33%. Over the same years the median rose 20% in cities and large towns, 20% in towns and 19% in villages.
Buyers moved fast. In the 12 months to May 2021, sales of countryside homes were 23% higher than two years earlier, while sales in cities and large towns were almost unchanged (up 0.3%).
The fade: 2023 to 2026
By the 12 months to May 2026 the countryside median had fallen to £400,000, 6% below 2023. Per square metre, which allows for the size of homes, the fall was 3%. Cities and large towns stayed at £300,000, and towns (up 3%) and villages (up 2%) edged higher.
That leaves the countryside 25% above 2019, against 20% for cities and large towns, 23% for towns and 21% for villages.
Villages moved like towns
The pandemic effect was mostly in hamlets and open countryside, about 4% of sales. Villages, built-up places of under 10,000 people, rose 21% since 2019, close to towns. Drawing the line at 5,000 or 20,000 people instead gives 22% to 25% for every size of place below a city.
Nationwide found the same pattern on a different measure: prices in predominantly rural local authorities rose 23% from December 2019 to December 2024, against 18% in predominantly urban ones. It linked the gap to the pandemic, but said "these effects have now faded" (Nationwide, May 2025).
What this means for you
- The countryside premium is off its peak, not gone. The median countryside home cost 28% more than a city home in 2019 (£320,000 against £250,000), 42% more in 2023 and 33% more now.
- Village prices move like town prices. If you are leaving a city for space, a village has followed the wider market, not the pandemic boom and fall.
- Sales have held up best in the countryside. They are 9% below 2019, against 17% in cities, so homes there are still changing hands.
How we did this
We placed each home sold in England & Wales by its own map point (HM Land Registry price paid). Inside an Ordnance Survey built-up area of 100,000 or more residents is a city or large town, 10,000 to 99,999 a town, and under 10,000 a village (10,000 is the line ONS draws between urban and rural). Outside any built-up area is hamlets and open countryside. Residents are ONS's mid-2024 estimates for the output areas mostly inside each built-up area, which slightly undercounts some towns.
Years run June to May. The 12 months to May 2024 are left out, as our data is missing most sales from October to December 2023, so the peak may have come later than May 2023. We counted category B sales in every year, as our older data flags few of them. Prices are medians in cash terms. The latest months are still being registered, so recent sales counts are a little low.
Check your area
See prices and sales in your village or town on the map at trackmystreet.com/uk.
Data
- Price paid data, Jun 2018 to May 2026 (Jun 2023 to May 2024 left out): HM Land Registry (Open Government Licence v3.0)
- OS Open Built Up Areas: Ordnance Survey (OS OpenData licence)
- Small area population estimates, mid-2024: Office for National Statistics (Open Government Licence v3.0)
- Energy Performance Certificates (floor area): Department for Energy Security and Net Zero / MHCLG (Open Government Licence v3.0)
Changes to this article
- 2026-11: first published.